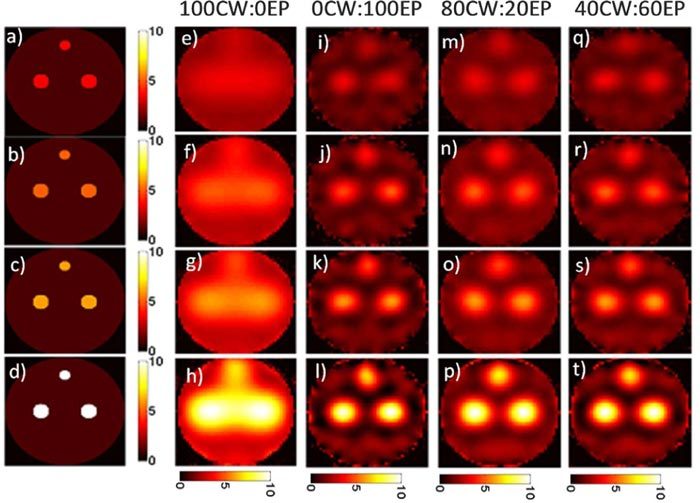
Fig. 8.

A series of objects with three fluorescent inclusions of varying concentration (a-d) with background autofluorescence are shown along with the reconstructed images for pure quasi-CW data (e-h) and pure EP data (i-l). Images produced with the HDS reconstruction approach with 80CW:20EP (m-p) and 40CW:60EP (q-t) data mixes are shown.
