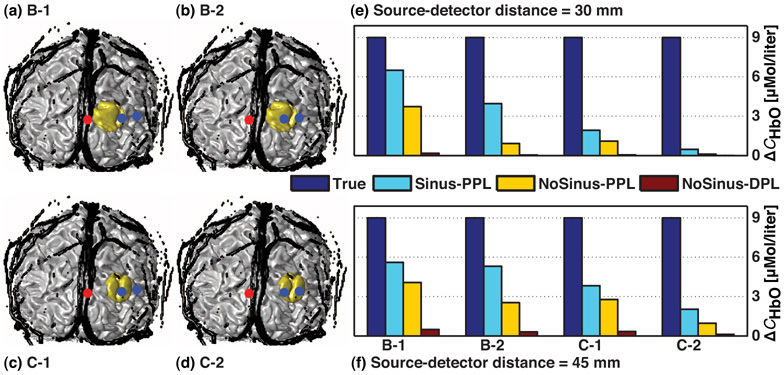
Fig. 4.

(a)–(d) 3D coronal views of the anatomical head model including the extra-cerebral vasculature (in black) and the regions of activation B and C (in gold) superimposed with optical arrays 1 and 2, respectively. Sources and detectors are represented by red and blue dots, respectively. (e)–(f) Corresponding recovered changes in oxyhemoglobin concentration ΔCHbO for source-detector distances of 30 and 45 mm, respectively. Four values are illustrated and correspond to: (blue) true change (9µMol/ℓ) simulated in the region of activation, (cyan: Sinus-PPL) change recovered using the head model containing the extra-cerebral vasculature and the partial pathlength, (yellow and dark red) changes recovered when the vasculature was not taken into account and using the partial pathlength (NoSinus-PPL), and the total differential pathlength (NoSinus-DPL).
