
Fig. 5.
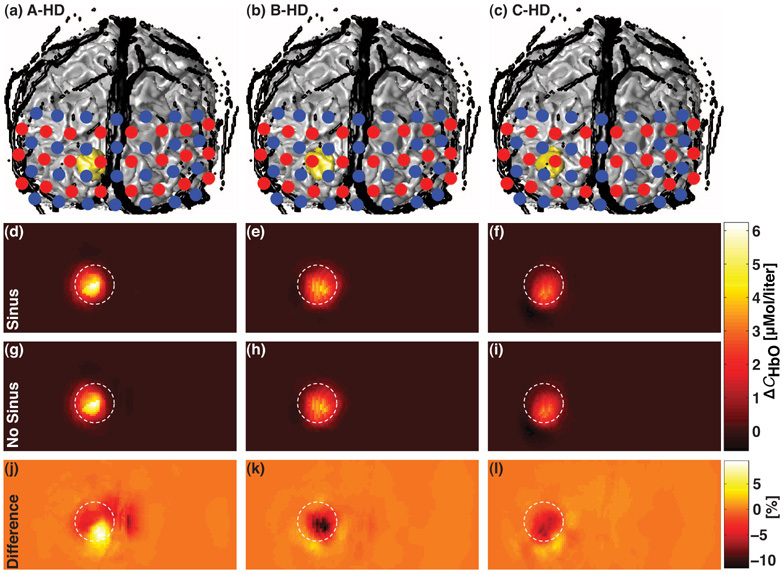
(a)–(c) 3D coronal views of the anatomical head model including the extra-cerebral vasculature (in black) and the regions of activation A, B and C (in gold) superimposed with the HD grid. Sources and detectors are represented by red and blue dots, respectively. A true change ΔCHbO = 9µMol/ℓ was simulated in the region of activation. (d)–(f) Corresponding recovered changes in oxyhemoglobin concentration ΔCSinusHbO estimated with the model including the extra-cerebral vasculature (Sinus). (g)–(i) Corresponding recovered ΔCNoSinusHbO estimated when the vasculature was not modeled (No Sinus). (j)–(l) Corresponding normalized differences in percentage between ΔCHbO reconstructed from the two anatomical models. All images were posterior coronal projections of a cortical shell of 1 cm of thickness and represent the field of view of the HD grid when removing the scalp and the skull [13]. The white dashed circle superimposed on each 9 reconstruction maps indicated the diameter of the region of activation.