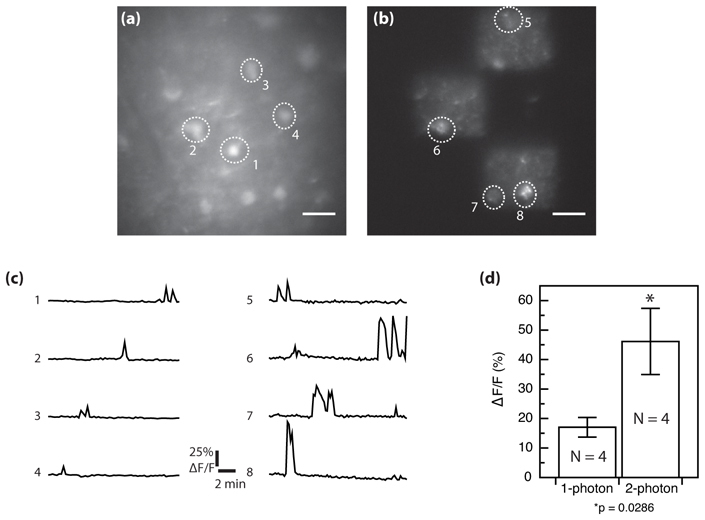
Fig. 3.

Comparison between one-photon and TF functional imaging in brain slice from two independent spontaneous activity measurements. Fluorescence from Fluo-4 AM calcium indicator loaded in a P8 300 µm rat hippocampal slice. (a) one-photon wide-field imaging. (b) Wide-field TF imaging of the same region with patterned illumination. Three square subregions were selected for illumination using the SLM. (c) Fluorescence fluctuations (ΔF/F) corresponding to intracellular free calcium elevation revealed by one-photon wide-field (left) and by TF patterned illumination (right). (d) Mean (± SEM) (ΔF/F) amplitudes from 4 cells for each imaging condition. Statistical test is Mann-Whitney and the difference between means is significant (p = 0.0286). Scale bars in (a) and (b) are 20 µm.
