Summary
Nearly complete brain ischemia under normoglycemic conditions results in death of only selectively vulnerable neurons. With prior elevation of brain glucose, such injury is enhanced to include pancel1ular necrosis (i.e., infarction), perhaps because an associated, severe lactic acidosis preferentially injures astrocytes. However, no direct physiologic measurements exist to support this hypothesis. Therefore, we used microelectrodes to measure intracellular pH and passive electrical properties of cortical astrocytes as a first approach to characterizing the physiologic behavior of these cel1s during hyperglycemic and complete ischemia, conditions that produce infarction in reperfused brain. Anesthesized rats (n = 26) were made extremely hyperglycemic (blood glucose, 51.4 ± 2.8 mM) so as to create potentially the most extreme acidic conditions possible; then ischemia was induced by cardiac arrest. Two loci more acidic than the interstitial space (6.17–6.20 pH) were found. The more acidic locus [4.30 ± 0.19 (n = 5); range: 3.82–4.89] was occasional1y seen at the onset of anoxic depolarization, 3–7 min after cardiac arrest. The less acidic locus [5.30 ± 0.07 (n = 53); range 4.46–5.93)] was seen 5–46 min after cardiac arrest. A smal1 negative change in DC potential [8 ± 1 mV (n = 5); range −3 to −12 mV and 7 ± 2 mV (n = 53); range +3 to −31 mV, respectively] was always seen upon impalement of acidic loci, suggesting cellular penetration. In a separate group of five animals, electrical characteristics of these cells were specifically measured (n = 17): membrane potential was −12 ± 0.2 mV (range −3 to −24 mY), input resistance was 114 ± 16 MΩ (range 25–250 MΩ), and time constant was 4.4 ± 0.4 ms (range 3.0–7.9 ms). Injection of horseradish peroxidase into cells from either animal group uniformly stained degenerating astrocytes. These findings establish previously unrecognized properties of ischemic astrocytes that may be prerequisites for infarction from nearly complete ischemia: the capacity to develop profound cellular acidosis and a concomitant reduction in cel1 membrane ion permeability.
Keywords: Acidosis, Astrocytes, Glia, Infarction, Intracel1ular pH, Ischemia, pH microelectrodes
Excessive brain acidosis is thought to be required for infarction from nearly complete ischemia under hyperglycemic conditions (Myers and Yamaguchi, 1977; Ginsberg et al., 1980; Welsh et al., 1980; Kalimo et al., 1981; Rehncrona et al., 1981; Pulsinelli et al., 1982). However, the cellular and physiological bases for such injury remain incompletely defined. Plum (1983) reasoned that an excessive acidosis derived from elevated glucose stores within ischemic brain was particularly deleterious to astroglia since these cells showed marked histological changes when viewed by both light and electron microscopy (Kalimo et al., 1981; Petito et al., 1982). Later, Kraig and coworkers (1986) used calculation of intracellular pH (pHi) based on interstitial pH (pHo), tissue carbon dioxide tension, and bicarbonate content measurements to propose that the excessive cellular acidosis in hyperglycemic and complete ischemia occurred mainly in astrocytes. It was suggested that astroglial pH fell to aproximately 5.2 while neuronal cytoplasm equilibrated with pHo (6.2) due to the high membrane ionic permeability of anoxic central neurons (Grossman and Williams, 1971; Fujiwara et al., 1987). Implicit in this model of ischemic brain was the accumulation of acid equivalents within astroglia and a reduced permeability of the astrocytic cell membrane to ionic species. Previous models of ischemic brain had not considered a heterogeneous distribution of proton equivalents.
That astroglia could become markedly more acidotic than either neurons or the interstitial space is contrary to the generally held concept of ischemic brain as a homogeneous system. For example, it has been proposed that ischemic brain cells do not retain intact plasma membranes (Siesjö, 1984), or that all ischemic brain cells share uniform acid–base behavior, thus reaching the same pH after a reduction of blood flow (Von Hanwehr et al., 1986). Here we report the use of ultrafine-tipped pH-sensitive microelectrodes to provide the first direct evidence that mammalian astrocytes become 1–2 orders of magnitude more acidotic than the interstitial microenvironment during hyperglycemic and complete ischemia. Portions of these results have appeared in preliminary form (Kraig and Nicholson, 1986, 1987; Kraig and Chesler, 1987).
MATERIALS AND METHODS
Animal preparation and recording
Twenty-six male Wistar rats (250–400 g) were prepared for hyperglycemic and complete ischemia as previously described (Kraig et al., 1986). Animals were anesthetized with halothane (5% induction; 3% maintenance during surgical procedures; 1.0–2.0% during electrophysiological recordings) and ventilated spontaneously throughout experiments, breathing a 30% oxygen–nitrogen mixture. Animals were warmed to 37°C via a water jacket. A craniotomy was made and a superfusion cup placed over either frontal (centered 2 mm lateral to the sagittal suture and 3 mm anterior to bregma) or parietal (centered 2 mm lateral to the sagittal suture and 1 mm posterior to bregma) cortex. Warm (37°C) Ringer’s solution was administered through the superfusion cup at a rate of 1–2 mllmin. Ringer’s solution consisted of (in mM): Na+ 143.5; K+ 3.0; Ca2+ 1.5; Mg2+ 0.7; Cl− 115; HC03− 26.4; gluconate 9.6; and glucose 5.0; when equilibrated with 5% carbon dioxide and 95% oxygen the mixture was pH 7.30–7.40 at 25°C. A tail artery and femoral vein were cannulated for arterial blood gas sampling and KCl injection, respectively (see below).
For electrophysiological recordings, animals were mounted in a standard stereotaxic apparatus. Ionselective microelectrodes were mounted on a Canberrastyle micromanipulator (Narishige Scientific Instruments Lab., Tokyo, Japan). Superfusate pH served as a standard calibration point for all ion-selective microelectrodes before they were advanced 400--800 μm below the pial surface to their initial recording position, prior to the onset of ischemia. The superfusion cup was then partially filled with light mineral oil to retard egress of carbon dioxide from the pial surface after the onset of ischemia. Arterial blood gas variables [pH, arterial oxygen tension (PaO2), and arterial carbon dioxide tension (PaCO2)] were stabilized and monitored with a Corning 158 blood gas analyzer (Ciba-Corning Diagnostics Corp., Medfield, MA, U.S.A.). Brain glucose stores were elevated to an extremely high level by intraperitoneal injection of 0.93 M D-glucose (8.35 g/kg) so as to create potentially the most acidic brain condition possible after cardiac arrest. In this way pH measurements could be regarded as a relatively firm upper limit to those that might be seen under more moderate glycemic conditions or less complete ischemic conditions such as those seen during nearly complete global ischemia (Pulsinelli et al., 1982). Blood glucose was measured with a Glucometer (Miles Laboratories, Naperville, IL, U.S.A.). Approximately 15 min after glucose injection, when brain levels approach a new steady state (Lund-Andersen, 1979), ischemia was induced by cardiac arrest from intravenous injection (0.5 ml) of 1 M KCI. Movement of micro electrodes in search of intracellular recording loci did not begin until 5–7 min after the onset of ischemia, a time by which the interstitial compartment reached its peak acidosis (Kraig et al., 1985, 1986). Recording sessions continued for up to 46 min after the onset of ischemia. We presumed that pHo remained relatively constant throughout this period since it does so for at least 20 min during hyperglycemic and nearly complete ischemia (Kraig et al., 1985), in which brain acid–base conditions, because of residual blood flow, are more variable than those in the current experiments. Microelectrodes were connected to an A-1 Axoprobe amplifier system (Axon Instruments, Inc., Burlingame, CA, U.S.A.). Reference barrel potentials were electronically subtracted from ion-barrel potentials to yield the pH signal. Data was filtered at 2 Hz and stored on video tape with a DR-484 neurocorder (Neurodata, New York, NY, U.S.A.). A 1 M KCI, 3.5% agar bridge placed on muscle adjacent to the craniotomy served as the indifferent electrode. Membrane impedance and time constants were measured by use of the standard bridge imbalance technique.
Electrode fabrication and calibration
Proton-sensitive microelectrodes based on tridodecylamine are reported to show super-Nerstian voltage response pH changes below 6 (Ammann et al., 1981) and sensitivity to changes in carbon dioxide tension (Aickin, 1984). Since anticipated astrocytic pH lies below pH 6 and tissue carbon dioxide tension rises to 389 Torr during hyperglycemic and complete ischemia, we characterized the output of pH-sensitive microelectrodes used in this study in terms of these variables. Futhermore, since our electrode characteristics differed from those in the literature, we detail our fabrication technique below and confirm their ability to accurately measure pHi in skeletal muscle cells.
Tridodecylamine-based proton exchanger was mixed (wt/%) from basic components (10% tridodecylamine; 0.7% sodium tetraphenylborate; 89.3% 2-nitrophenyl octyl ether; all from Fluka Chern. Corp., Ronkonkoma, NY, U.S.A.). With stirring, the above components produced an orange-colored solution that promptly turned yellow-green upon exposure to 100% carbon dioxide. Stirring under carbon dioxide was continued for 12–16 h before the resultant exchanger was used in the fabrication of pH-sensitive microelectrodes. New solutions of proton exchanger (0.5 cc) were prepared every 30–60 days.
Double-barrel electrodes were initially fabricated in a twisted, “figure eight” configuration, but for most experiments an eccentric pattern (Thomas, 1986) was employed. Eccentric electrode blanks were made by gluing a 1.2 mm (outside diameter) borosilicate glass tube (with an internal microfilament) to the inside of a shorter length of 3 mm (outside diameter) borosilicate glass. Electrodes were pulled on a PE-2 puller (Narishige Scientific Instruments Lab., Tokyo, Japan). Microelectrodes were silanized by a technique modified from that described by Borelli et al. ( 1985). Distilled water was placed (to less than the beginning of the shank) in the inner, reference barrel, and pure N,N-dimethyl-trimethylsilylamine (Fluka) was added to a similar depth in the outer, ion barrel. Next, a hot-air gun was used to heat the electrode in a two-step procedure. First, 200°C heat was applied to the electrode for approximately 60 s while suction was applied to the ion barrel via a 30 gauge, 2-inch-Iong stainless steel needle. Second, the suction needle was moved to the reference barrel, and the heat was raised to 700°C for 2–5 min. The first maneuver removed silylamine from the ion barrel. The second heating maneuver was necessary to remove water from the reference barrel. KCl (0.5 M) was then added to the reference barrel. Finally, proton exchanger was added to the ion barrel, followed by a column of phosphate buffer (Ammann et al., 1981). Completed electrodes were stored in 150 mM NaCl.
Electrode characteristics are shown in Figs. 1 and 2. Electrodes were calibrated away from animals in a series of 50 mM potassium phosphate-buffered solutions (adjusted to a final pH with either 1 M NaOH or 1 M HCl). Electrodes responded linearly between 3.80 and 7.70 pH with a slope of 54 ± 0.8 mY (n = 24; values expressed here and throughout as mean ± SEM) and a correlation coefficient of 0.999 (Fig. 1). The response was nonlinear below 5.50 pH when the exchanger had been mixed more than 60 days prior to use. Neither slope nor offset potential were influenced by different carbon dioxide tensions from 0 to 100% (Fig. 1), consistent with characteristics of larger extracellular pH-sensitive microe1ectrodes based on tridodecylamine (Kraig et al., 1986). Electrode response time and ability to accurately measure pHi was estimated by quickly advancing an electrode tip into skeletal muscle cells of an anesthetized and artificially ventilated rat (Fig. 2). Upon penetration (n = 14) into muscle cells, pH-sensitive microelectrodes recorded a new steady-state pH (defined as the 95% response time) in 1.9 ± 0. 1 s (range 0.9–3.2 s). Blood physiological variables were within normal range (Table 1). Muscle pH was 7.02 ± 0.01 (range 6.84-7.20), and membrane potential was 75.4 ± 0.4 mV (range 69–83), values consistent with those previously reported for mammalian skeletal muscle (Aickin and Thomas, 1977). Initial pHi measurements were made with ion-selective microelectrodes in which the reference barrel was filled with 150 mM KCl. In later experiments, the reference barrel contained 0.5 M KCI. To test whether these changes in reference barrel KCl concentration caused any significant differences in membrane potential measurements, we filled individual eccentric electrode barrels with either 150 mM KCl, or 0.5 M KCl in outer barrels, and 3 M KCl in inner barrels. Electrodes of either variety were used to measure rat muscle membrane potential. Mean membrane potential measured with 150 mM KCl and 0.5 M KCl were, respectively, 0.9 ± 0.2 mV and 1. 1 ± 0.2 mV less than membrane potentials measured with 3 M KCl. Since this represents a pH measurement error of less than 0.02 pH, pHi measurements were not corrected for differences in reference electrode electrolyte.
FIG. 1.
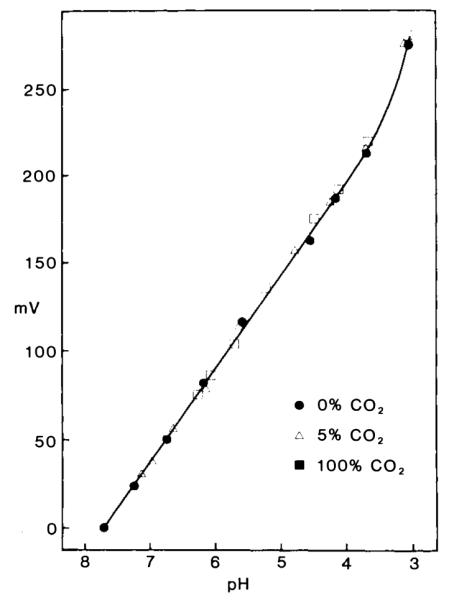
Response on intracellular pH microelectrodes to changes in pH at different carbon dioxide tensions. Potassium phosphate (50 mM) solutions were adjusted to a specific pH with either 1 M NaOH or 1 M HCl and equilibrated with different carbon dioxide tensions (0%, solid dots; 5%, open triangles; 100%, solid squares). Electrode response to all solutions was linear (correlation coefficient 0.999) between pH 3.80 and 7.70 and not influenced by changes in carbon dioxide tension. In this example, electrode response was 53 mV per decade change in pH.
FIG. 2.
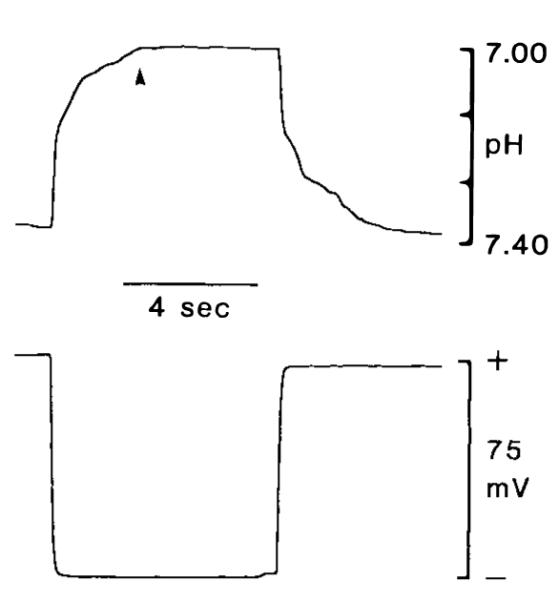
Response time of intracellular pH microelectrodes. Response time was estimated by quickly advancing the electrode tip into skeletal muscle cells of an anesthetized and artificially ventilated rat. Time to 95% (arrowhead) of total response was 1.9 s for pH recordings (upper trace). For comparison, membrane potential change is shown in lower trace.
TABLE 1.
Blood physiologic variablesa
| Experiments |
|||||
|---|---|---|---|---|---|
| pHi (astrocyte) (n = 26) |
Impedance (n = 5) |
||||
| pHi (muscle) (n = 1) |
Pre-glucose infusion |
Post-glucose infusion |
Pre-glucose infusion |
Post-glucose infusion |
|
| pH | 7.41 | 7.31 ± 0.01 | 7.24 ± 0.01 | 7.27 ± 0.02 | 7.22 ± 0.01 |
| PaCO2 (Torr) | 48 | 62 ± 2 | 67 ± 2 | 68 ± 3 | 68 ± 3 |
| PaO2 (Torr) | 102 | 108 ± 2 | 108 ± 2 | 101 ± 4 | 112 ± 2 |
| Glucose (mM) | 6.5 | 8.0 ± 0.3 | 51.4 ± 2.8 | 7.6 ± 1.4 | 26.9 ± 1.3 |
| Hematocrit (%) | 43 | 42 ± 1 | 41 ± 1 | 42 ± 1 | 41 ± 1 |
| Systolic blood pressure (mm Hg) | 115 | 109 ± 8 | 109 ± 2 | 99 ± 3 | 101 ± 1 |
| Rectal temperature (°C) | 37.0 | 36.9 ± 0.1 | 37.0 ± 0.1 | 37.2 ± 0.1 | 37.0 ± 0.1 |
All entries are values (mean ± SEM) measured in arterial blood from anesthetized and artificially ventilated animals under control conditions. n, number of animals.
Exposed brain was covered by mineral oil during ischemia to retard egress of carbon dioxide. However, DC offsets can occur when passing pH electrodes through mineral oil (unpublished observations). Therefore, to calibrate pHi recordings most accurately, ischemic pHo was used as a standard reference point since it is known to lie between 6. 17 and 6.20 (Kraig et al., 1986) under the conditions used in the experiments reported here. To help ensure that the reference pHo was from the ischemic, interstitial space, electrodes were repeatedly moved up and down approximately 300 μm in the superficial neocortex. Only after a steady-state pH value was achieved were intracellular recordings attempted.
Horseradish peroxidase staining
Horseradish peroxidase (HRP) staining was used for histological identification of selected foci of pHi and impedance measurements. Reference barrels of pH-sensitive microelectrodes and single-barrel electrodes (used for impedance measurements; see below) were filled with 9% (g/IOO ml) HRP (Boehringer-Mannheim, Mannheim, F.R.G.) in 0.5 M KCl and phosphate buffer (7.6 pH). HRP was injected into cells electrophoretically (negative pulses of 840 ms/s, 10–30 nA/min). Brains were subsequently fixed by intracardiac perfusion with phosphate-buffered formalin and processed as previously described (Chesler and Kraig, 1987).
RESULTS
Acid–base changes
Preischemic blood physiological variables (26 animals) were consistent with those previously reported for halothane-anesthetized and spontaneously ventilated rats (Mutch and Hansen, 1984; Kraig et al., 1986) (Table 1). Approximately 15 min after intraperitoneal injection of glucose, and immediately before the onset of ischemia, blood glucose was 51.4 ± 2. 8 mM.
Brain pHo was not systematically measured since previous work has shown it to lie within a narrow range before and after the onset of complete ischemia. For example, anesthetized and spontaneously breathing rats have a pHo that is approximately 0.05–0.07 more acid than arterial pH (Mutch and Hansen, 1984; Kraig et al., 1986). In accordance with these previous measurements, in five experiments reported here, pHo was 7.26 ± 0.02 while arterial pH was 7.31 ± 0.01 (n = 26).
With cardiac arrest, pHo initially became progressively more acidic and then displayed a characteristic “alkaline shift” at the onset of anoxic brain cell depolarization before a further acidification (Mutch and Hansen, 1984). During hyperglycemic ischemia (i.e., blood glucose greater than 17 mM before the onset of ischemia), pHo always falls to 6.17–6.20 (Kraig et al., 1986). Under these conditions, two recording loci were noted with a pH lower than that of ischemic interstitial space. The more acidic locus was only observed in 5 instances, at the onset (i.e., 3–7 min after cardiac arrest) of anoxic depolarization (Fig. 3). Without movement of the electrode, pH suddenly fell to a level that was extremely acidic [4.30 ± 0.19 (n = 5); range 3. 82–4.89] with respect to ischemic interstitial space (6.17–6.20 pH). Several observations support the contention that these recordings were from the intracellular space. First, withdrawal of the electrode caused recorded pH to rise slowly toward the interstitial level. Simultaneously recorded DC potential abruptly shifted millivolts more positive (see below). In addition, with injection of constant current pulses, an apparent membrane impedance and membrane time constant were noted in the acidic compartment. Upon withdrawal of the electrode, only the impedance and time constant of the electrode were observed (see below).
FIG. 3.
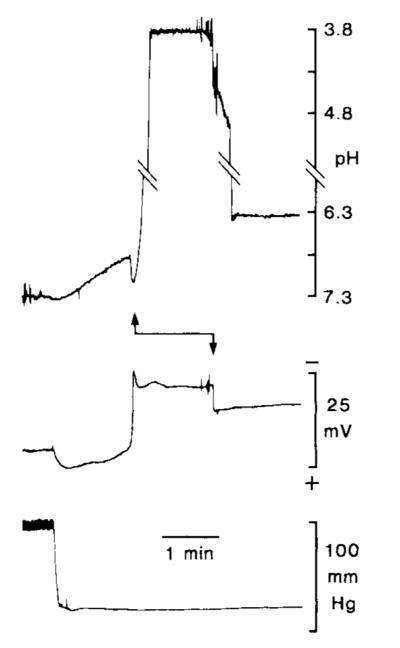
Extreme level of cellular acidity seen shortly after the onset of hyperglycemic and complete ischemia. Double-barrel pH-sensitive microelectrodes were positioned approximately 400–800 μm below the parietal pial surface. With the onset of cardiac arrest, systolic blood pressure (bottom record) quickly fell to a minimum, pHo (top record) shifted slowly to more acid, and interstitial DC potential (middle record) became transiently more positive. Next, anoxic depolarization (large negative going deflection in DC record) and an alkaline transient occurred, indicating that the electrode still recorded from interstitial space. Suddenly, without further manipulation of the electrode (during recovery of the alkaline shift), recorded pH shifted (upward arrow) orders of magnitude more acidic than that seen in the interstitial space, suggesting entry into an extremely acidic intracellular compartment. In this example, pHi reached a peak of 3.82. Further evidence supporting the contention that this extreme acidosis occurred within cells comes from recorded signal behavior when the electrode was raised approximately 200 μm: DC potential abruptly shifted a few mV more positive and pH slowly returned toward an interstitial level. Since astrocytes are likely to swell with the onset of anoxic depolarization (see text), we presume that stationary pH-sensitive microelectrodes fortuitously entered astrocytes as they expanded. The record of pH is interrupted by diagonal lines to allow visualization of lower- and uppermost portions of the record.
[Published evidence exists to suggest that astrocytes swell when interstitial space shrinks during spreading depression (reviewed in Kraig and Petito, 1989). Since interstitial space shrinks to a similar degree during anoxic depolarization (Hansen and Olsen, 1980), astrocytes may swell at the same time. Thus, we speculate that in the above instances our stationary microelectrodes fortuitously entered astrocytes swelling during anoxic depolarization.]
The second set of acidic loci was recorded more often, 5–46 min after the onset of complete ischemia (Fig. 4). While advancing pH-sensitive microelectrodes through ischemic cortex, acid compartments were encountered where pH fell to an average value of 5.30 ± 0.07 (n = 53; range 4.46–5.93). Again, a membrane potential and apparent membrane impedance and time constant were noted with impalement of each compartment (see below). These findings strongly suggested that recording loci were from intracellular space. Injection of HRP (see below) demonstrated that these recordings were made strictly from cortical astrocytes.
FIG. 4.
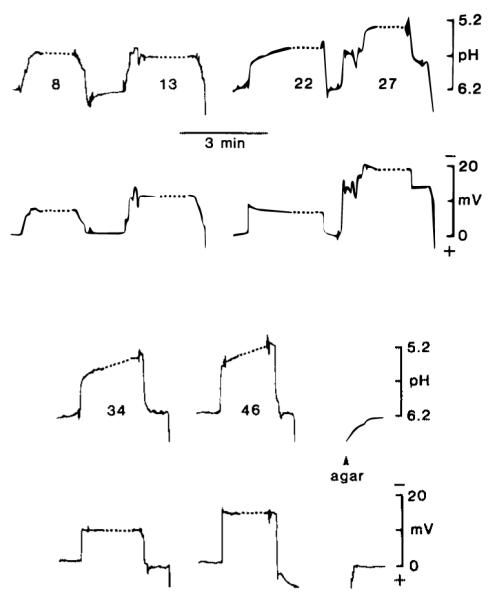
Typical pHi changes. Records shown are from a single experiment. Top and third panel show pH changes and second and fourth panel simultaneous DC changes. Number associated with each pH change indicates the number of minutes after ischemia. Dotted lines associated with each cellular penetration represent a condensed 3 min period during which HRP was electrophoretically injected. Breaks in pH and DC records (Le., at 13 min) indicate that the electrode was withdrawn from the brain. After the final withdrawal, the pH-sensitive microelectrode was advanced into a phosphate-buffered (6.20 pH) agar gel (3.5%) containing 150 mM NaCl.
Changes in membrane electrical properties
A small change in DC potential was always seen upon impalement of an acidic compartment. The early, more acidic loci (Fig. 3) were associated with a negative shift of 8 ± 1 mV (n = 5; range −3 to −12 mV). The larger set of less acidic loci (Fig. 4) were associated with a negative shift of 7 ± 2 mV (n = 53; range +3 to −31 mV).
Membrane impedance from intracellular recording loci was determined by bridge imbalance in a separate group of five ischemic and hyperglycemic animals. Single-barrel microelectrodes were filled with 0.5 M KCI and 9% HRP (electrode impedance 20–50 MΩ). Preischemic physiologic variables are listed in Table 1. After intraperitoneal injection of glucose (and immediately before cardiac arrest), blood glucose was 26.9 ± 1.5 mM. Cells were penetrated between 5 and 34 min after the onset of ischemia. A typical recording during ischemia is shown in Fig. 5. Membrane potential was −12.1 ± 0.2 mV (n = 21; range −3 to −24 mV) relative to interstitial DC potential. Membrane time constant was 7.6 ± 0.4 ms (n = 17; range 3.0–7.9 ms), and input resistance was 114 ± 16 MΩ (n = 17; range 25–250 MΩ). Injection of HRP through conventional single-barrel microelectrodes showed these elements to be protoplasmic astrocytes (Fig. 6, upper right; also see below).
FIG. 5.
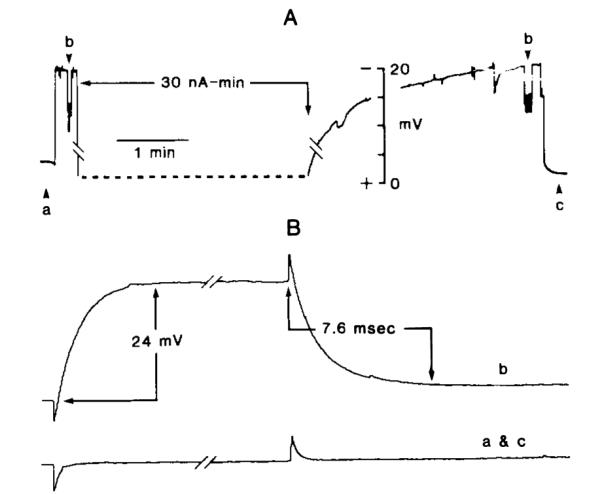
Passive electrical properties of presumed astrocytes from hyperglycemic and ischemic brain. A: Membrane potential in “real time.” B: Bridge balance records made at specific times (Le., a, b, c in A). Records are interpreted as follows. First, bridge was balanced (record a in B) at time a in A using a 0.2 nA–40 ms pulse. Second, a cell was penetrated, as evidenced by negative deflection in DC tracing A to approximately −18 mV. This was followed by reassessing bridge balance at b in A. Resultant bridge imbalance of 24 mV is shown in record b in B and corresponds to an input resistance of 120 MΩ. Third, HRP was injected (dotted line in A) at a rate of 10 nA for 3 min, and when the DC potential returned to its full negative value, bridge balance was again reassessed (right-hand b in A). When the electrode was withdrawn slightly, DC potential returned to its interstitial value. Bridge balance was tested at time c in A and found (recording c in B) to be back in balance.
FIG. 6.
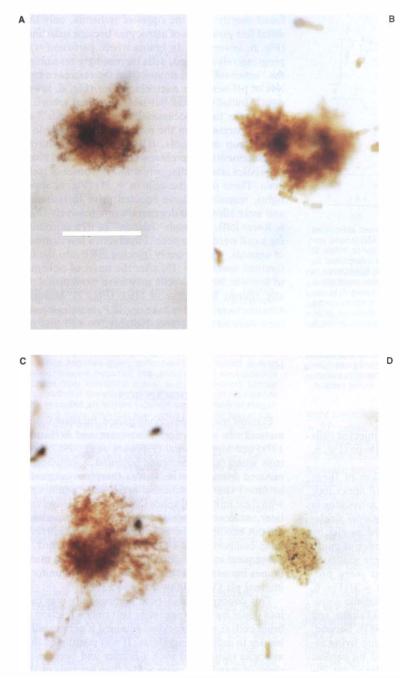
Histological evidence of progressive changes in astrocytic shape after the onset of hyperglycemic and complete ischemia. Cells shown were stained in parietal cortex. A: Normal protoplasmic astrocyte. Darker major arborizations and cell body are evident near center of cell. B: Cell stained after cardiac arrest with a single-barrel electrode during measurement of membrane passive electrical characteristics (see Fig. 5) within minutes after the onset of ischemia. Notice that the delicate “leaf-like” distal processes are less evident. In addition, no evidence of major cellular branches can be seen. C: Cell stained in a live, anesthetized animal, under conditions analogous to those used to stain the o normal astrocyte above. Here, however, the brain was not perfused with fixative until 20–30 min after cardiac arrest. Further isolation of distal cellular processes, consistent with the phenomenon of clasmatodendrosis, is evident. D: Cell stained with HRP from the reference barrel of a pH-sensitive microelectrode. Here HRP was electrophoretically injected after a pHi level of 5.14 was recorded. Recording was made 30–40 min after the onset of ischemia. Cell has an ameboid appearance, as first noted by Alzheimer in 1910. All animals were made hyperglycemic approximately 15 min before the onset of ischemia. Calibration bar at lower right is 50 μm and applicable to all micrographs.
Horseradish peroxidase staining
In an effort to identify electrode recording loci histologically, HRP was injected through the reference barrel of pH-sensitive microelectrodes. Five cells were stained in this manner. The injected cells lacked processes and had an ameboid shape (Fig. 6, lower right).
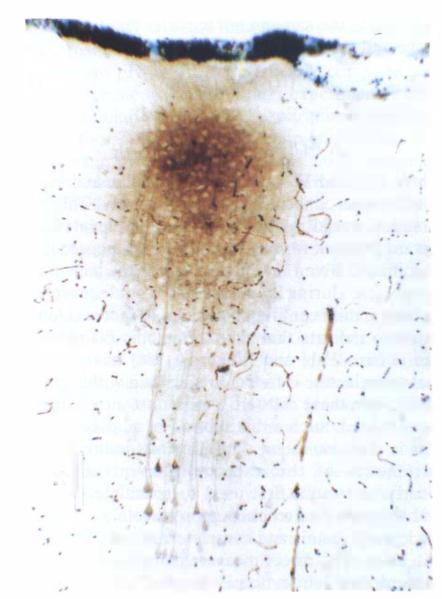
To further characterize the evolution of these morphologic changes, we injected HRP under four other circumstances. Fist, we stained astrocytes in live, anesthetized animals with conventional single-barrel electrodes. Cells were identified as glia by their high membrane potential and absence of injury or spontaneous discharges. Animals were sacrificed by perfusion-fixation, and the brains were processed for HRP staining. These cells (n = 3) (Fig. 6, upper left) had the features of protoplasmic astrocytes as noted in previous studies (Takato and Goldring, 1979; Chesler and Kraig, 1987). Second, HRP was similarly injected (n = 14) into living astrocytes, but animals were then killed by cardiac arrest, and perfusion–fixation was delayed for 20–40 min to allow ischemic-morphologic changes to occur. In both groups, animals were made hyperglycemic (blood glucose of 26.9 ± 1.3 mM) approximately 15 min before the onset of perfusion–fixation (or ischemia). In these latter experiments morphologic disruption of cells increased with duration of ischemia. For example, in animals perfused perfused shortly after the onset of ischemia, only the distal fine processes of astrocytes becalPe indistinct (Fig. 6, lower left). In brains where perfusion was progressively delayed, cells increasingly resembled the “ameboid” cells stained from the reference barrels of pH-sensitive microelectrodes (Fig. 6, lower right). Initially, distal but later proximal arborizations were lost. Occasionally small “islands” of HRP separated from the main cell were seen. In a third group of animals, HRP was injected during measurements of membrane passive electrical characteristics after cardiac arrest and the onset of ischemia. These particular cells (n = 11) (Fig. 6, upper right), resembled those injected prior to ischemia and were allowed to degenerate progressively (Fig. 6, lower left), although “islands” of dye surrounding a cell were never seen. Finally, in a fourth group of animals, we purposely injected HRP into the interstitial space (n = 10) after the onset of ischemia to see whether glial cells may have been artifactually stained by uptake of HRP (Fig. 7). Multiple neurons were found to take up HRP, but single neurons were never stained. Notably, no cell that resembled a normal or degenerating astrocyte was ever identified following interstitial injection of HRP.
FIG. 7.
Staining pattern of ischemic brain staining caused by injection of HRP into interstitial space. With injection into the interstitial space of ischemic brain, multiple neurons were always stained. Astroglia, in either normal or degenerating forms, were never visualized. Membrane transport processes are unlikely to account for this staining pattern since high-energy phosphates are completely absent and ion gradients similarly absent or significantly deteriorated. This staining pattern implies that neuronal membranes are permeable to HRP after the onset of hyperglycemic and complete ischemia while those of astrocytes are not. Calibration bar is 100 μm.
DISCUSSION
Plasma membrane conductance increases dramatically in neocortical (Grossman and Williams, 1971) and hippocampal (Fujiwara et al., 1987) neurons when their membrane potential is sufficiently reduced from hypoxia. It was therefore originally assumed that all ischemic brain cells equilibrate with their interstitial space (Siesjö, 1984). However, later, evidence suggested that proton equivalents did not equilibrate between interstitial and intracellular compartments (Kraig et al., 1985). Thus, a subsequent model incorporated intact plasma membranes but assumed that all cells attained a uniform internal pH (Von Hanwehr et al., 1986).
This concept of acid–base homogeneity was cast into doubt by data suggesting that only a fraction of brain cells (i.e., astrocytes) retained a permeability barrier to proton equivalents. It was postulated that astroglia maintained such a barrier and became an order of magnitude more acidic than neurons or the interstitial microenvironment during hyperglycemic and complete ischemia (Kraig et al., 1986). This model proposed that acid remained restricted to within astrocytic intracellular space due to: (a) continued production of proton equivalents there; and (b) decreased permeability of the astrocytic membrane to proton equivalents.
In the present study, direct pH measurements demonstrated that ischemic astrocytes can become 1–2 orders of magnitude more acidic than the interstitial space and retain intact plasma membranes. This was evidenced by a slight negative membrane potential, a high input resistance and prolonged membrane time constant, and restriction of HRP dye to intracellular space. These results provide the first direct support for the concept of acid sequestration to within astrocytes during hyperglycemic and complete ischemia.
Astrocytic membrane characteristics during ischemia
The input resistance of normal cortical astrocytes is typically less than 10 MΩ (Trachtenberg and Pollen, 1970; also for review, see Ransom and Carlini, 1986). Resistance increased by approximately an order of magnitude during hyperglycemic and complete ischemia. Normally, astrocytes also have a membrane time constant of less than 1 ms (Trachtenberg and Pollen, 1970; Ransom and Carlini, 1986). In experiments reported here the astrocytic membrane time constant was increased by approximately 1 order of magnitude, suggesting an increase in specific membrane resistance.
Cell input resistance depends on plasma membrane membrane surface area, specific resistance of the membranes, and the degree of electrical coupling to adjacent glial cells. Acidosis can influence each of these variables. First, morphologic evidence (Fig. 6) suggests that astrocytic, membrane surface area declines during hyperglycemic and complete ischemia. Thus, the progressive loss of astrocytic arborizations (Fig. 6) could play a role. Second, specific membrane resistance of these cells can be expected to rise during such ischemia, since conductance through astrocytic K+ channels is decreased by interstitial acidosis less extreme than that seen in these experiments (Walz and Hinks, 1987). Third, astrocytic coupling via gap junctions falls during hypercarbia (Conners et al., 1984) and therefore may be expected to fall due to the acidosis of hyperglycemic and complete ischemia. Finally, Newman (1986) has shown that most of the K+ conductance in salamander astrocytes is found at their endfoot processes. If rat astrocytes have a similar restriction of K+ conductance to their endfoot processes, the input resistance and time constant of these cells would rise as endfeet were lost during ischemia.
Evidence that ischemic astrocytes can undergo morphologic changes is lacking in the modern literature. However, such changes were first recognized by Alzheimer in 1910 (see Penfield, 1928). He noted that during ischemia astrocytes call undergo a process termed “clasmatodendrosis” (disintegration of branches), which causes the cells to assume an ameboid shape (Penfield, 1928).
Astrocytic pHi behavior during ischemia
The original models for the heterogeneous distribution of proton equivalents in ischemic brain relied on two primary assumptions (Kraig et al., 1986). The first assumption was that, unlike neurons, astrocytic membrane conductance does not increase during ischemia. Our present results (Fig. 5) demonstrate that astrocytic input resistance and membrane time constant are far greater than normal reported values during hyperglycemic and complete ischemia. Thus, conductive pathways for equilibration of proton equivalents would appear to be reduced. The second assumption was that membrane-based transport of proton equivalents is inhibited by acidosis. This notion has strong support based on results from a number of systems (for references, see Kraig et al., 1986). However, a weakness of this proposed acid–base model for ischemic brain is that it did not specifically deal with the behavior of nonionized acid molecules (Boris–Moller et al., 1988). Since such acid molecules rapidly diffuse through cell membranes (Jacobs, 1940), one might expect astrocytic acidosis to dissipate rapidly as uncharged lactic acid molecules diffuse out of cells. That acid remains elevated within astrocytes 46 min after the onset of ischemia (Fig. 4) indicates that acid–base species do not diffuse away from involved extraglial space. Indeed, such behavior would be expected in a closed system. In complete ischemia (i.e., absolute loss of blood flow) and nearly complete ischemia [Le., severe global reduction in blood flow to cerebral cortex (Pulsinelli et al., 1982)], the brain becomes a closed and virtually closed system, respectively. Under these conditions, equilibration of neutral lactic acid (HA) across the astrocytic cell membrane would occur (Fig. 8).
FIG. 8.
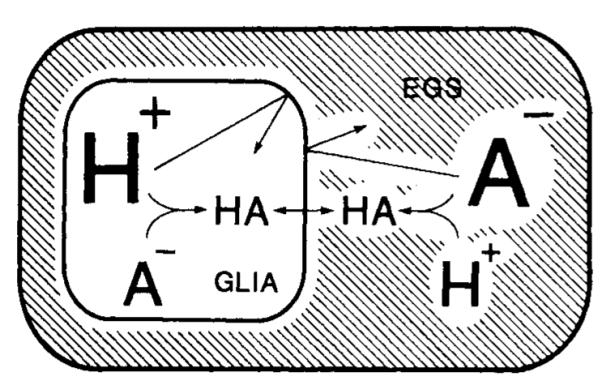
Model to suggest how extreme astrocytic acidosis can be maintained for prolonged periods during hyperglycemic and complete ischemia. Previously, a model was proposed to explain how pHo remained constant and astrocytic pH grew progressively more acidic during complete ischemia (Kraig et al., 1986). This model required that astrocytic membranes remain intact and that these cells progressively accumulate proton equivalents without absorbing bicarbonate buffer from the interstitial space. Acidic inhibition of membrane-based transport systems for proton equivalents was proposed as one means to retard egress of excess protons from cells. However, this phenomenon continued diffusion of nonionized lactic acid out of cells. The above schematic drawing deals with this latter issue. Astrocytic membranes are likely to remain permeable to nonionized organic acids (HA) such as lactic acid, so the concentration of HA can be expected to be equal within astrocytes and in extraglial space (EGS). If the astrocytic membrane is impermeable to charged species (H+ and A−), more acid will remain within astrocytes when more pH-related anions (such as lactate or bicarbonate) accumulate in the EGS. See text for further details.
Given equilibration of HA across the astrocytic membrane, and impermeability of the membrane to charged species, a stable proton gradient would be maintained in a closed system. For example,
| (1) |
and
| (2) |
where Ai− and Ao− are intracellular and interstitial conjugate bases, respectively (i.e., lactate). Assuming that the ionization equilibrium constant of lactic acid (Ka) is the same in intracellular and interstitial space and that
| (3) |
then (substituing Eqs. 1 and 2 into 3)
| (4) |
where Hi+ and Ho+ are the intracellular and interstitial proton concentrations, respectively. This formulation would predict that if Hi+ is elevated, an inward gradient for A− exists across the astrocytic membrane. Given the intact state of the astrocytic membrane during hyperglycemic and complete ischemia, this is entirely plausible. In fact, evidence exists to indicate that such an anionic distribution can occur. Walz and Mukerji (1988) have shown that more lactate is found outside than within astrocytes when these cells are exposed to anoxia in culture. Indeed, such a distribution of acid–base species is also consistent with previous indirect measurements of the extracellular/intracellular bicarbonate ratio, first used to speculate that pH within astrocytes reached approximately 5.20 during hyperglycemic and complete ischemia (Kraig et al., 1986). The direct measurements reported here showed that astrocytic pH reached an average of 5.30 ± 0.02 (n = 53). If this addition to our model of ischemic brain acid–base behavior proves correct, then blood–brain barrier permeability to pH-related variables (such as lactate, bicarbonate, or carbon dioxide, etc.) may be an important consideration for analyzing situations in which residual blood continues to flow to ischemic brain (Kraig and Chester, 1988a).
Thus far, only microelectrode-based pH measuring techniques have been used to provide evidence of severe astrocytic acidosis during ischemia. However, acid–base data from tissue averaging methods can be interpreted to support our findings. For example, Meyer et al. (1986) used umbelliferone, a fluorescence pH indicator dye, to show that average pHj in rabbit superficial cerebral cortex can fall as low as 5.30 during ischemia. Since these latter measurements were made from intact brain, the fluorescence signals came principally from the superficial cortical layers, where astrocytes predominate. Therefore, the lowest measured value of 5.30 pH, seen after cardiac arrest, may have reflected predominantly astrocytic pH during complete ischemia, in good agreement with measurements reported here. Although the fluorescence response of umbelliferone is reduced in the pH 5–6 range, these measurements are sufficiently sensitive to support our electrode-based measurements. Similarly, Chopp et al. (1987) used inorganic phosphate (31P) shifts from pH changes measured by nuclear magnetic resonance (NMR) spectroscopy to calculate an average pHi of 5.9 during nearly complete and hyperglycemic ischemia. Under experimental conditions similar to these latter experiments, Smith et al. (1986) use the Van Slyke technique to calculate an average pHi of 5.9. Since interstitial, neuronal, and astrocytic volumes are approximately 15, 52.5, and 32.5% of total neocortical volume, respectively (Hertz and Schousboe, 1975), pH 5.9 is consistent with our measurements of 5.3 for average astrocytic pHi given a pHo and neuronal pHi of 6.2 (Kraig et al., 1986).
Other workers using NMR spectroscopy were unable to detect evidence of an astrocytic acidosis greater than that present in the interstitial space during complete ischemia: the so-called split-peak signal (Boris-Moller et al., 1988). However, NMR spectroscopy, as used by these latter workers, should be unable to detect severe astrocytic acidosis. These investigators measured average pHi in whole brain samples that were allowed to equilibrate to atmospheric pressure in a solution for 10–15 min before measurements were made. Thus, carbon dioxide and lactate (see Fig. 8) could have diffused away from severely acidic astrocytes, allowing their pHi to rise to a higher level than that seen in our experiments. Furthermore, our measurements were confined to cortical astrocytes, while those of Boris-Moller et al. (1988) were made in whole brain samples in which relative astrocytic volume is likely to be less than that of cerebral cortex. Indeed, these authors propose a similar volume-dependent argument (Boris-Moller et al., 1988) to suggest why they did not observe an extreme acidosis consistent with that suggested to occur in astrocytes (Kraig et al., 1986).
Ammann (1986) has discussed the inability of NMR spectroscopy to resolve cellular differences in measured variables within tissues consisting of heterogeneous cell types. For example, rather than recording multiple 31P peaks in samples with widely varying pHi peaks in samples with widely varying pHi values, the technique shows only a single, broad peak. This is precisely what the records of Chopp et al. (1987) show from recordings made during hyperglycemic and nearly complete ischemia, conditions we postulate are associated with an astrocytic pH of 5.3 and interstitial (and perhaps neuronal) pH of 6.2.
The original suggestion of extreme astrocytic acidosis (Kraig et al., 1986) and confirmatory direct pHi measurements reported here are likely to be critical for understanding the cellular pathogenesis of brain infarction.
However, the ultimate importance of these results may lie in the fact that they direct attention to pHi changes and plasma membrane behavior of astrocytes. In a separate paper (Chesler and Kraig, 1989) we show that normal astrocytes can become profoundly more alkaline than the remainder of brain. In fact, the largest and most dynamic pH changes appear to occur in astrocytes rather than neurons or the interstitial space (Kraig and Chesler, 1988b). Since pHi changes can trigger and modulate vital activities of eukaryotic cells (Busa and Nucitelli, 1984), it is not surprising to find that most brain pH changes occur in astrocytes, cells that in the adult are among the most dynamic of the nervous system. Indeed, severe astrocytic acidosis from brain ischemia may be but one extreme of the diverse physiologic capacities of these cells.
Acknowledgment
This study was supported by The National Institutes of Neurological Disorders and Stroke, grants NS-19108 and NS-00767 (Teacher Investigator Development Award), The Lucille P. Markey Charitable Trust, and The University of Chicago Brain Research Foundation (R.P.K.). M.C. was supported by National Institutes of Neurological and Communicative Disorders and Stroke Training grant NS-07141. We thank Dr. L. Litt for helpful discussions and literature dealing with the ability of NMR spectroscopy to distinguish extreme levels of astrocytic acidosis in ischemic brain and Dr. Charles Nicholson for advice and assistance in the use of horseradish peroxidase staining techniques.
Abbreviations used
- HA
neutral lactic acid
- HRP
horseradish peroxidase
- NMR
nuclear magnetic resonance
- pHi
intracellular pH
- pHo
interstitial pH.
Footnotes
Dr. Chesler’s present address is Departments of Neurosurgery and Physiology, New York University Medical Center, 550 First Avenue, New York, NY 10016, U.S.A.
REFERENCES
- Aickin CC. Direct measurement of intracellular pH and buffering power in smooth muscle cells of guinea-pig vas deferens. J Physiol. 1984;349:571–585. doi: 10.1113/jphysiol.1984.sp015174. [DOI] [PMC free article] [PubMed] [Google Scholar]
- Aickin CC, Thomas RC. An investigation of the ionic mechanism of intracellular pH regulation in mouse soleus muscle fibers. J Physiol. 1977;273:295–316. doi: 10.1113/jphysiol.1977.sp012095. [DOI] [PMC free article] [PubMed] [Google Scholar]
- Ammann D. Ion-Selective Microelectrodes. Springer-Verlag; Berlin: 1986. p. 190. [Google Scholar]
- Ammann D, Lanter F, Steiner RA, Schulthess P, Shijo Y, Simon W. Neutral carrier based hydrogen ion selective microelectrodes for extra- and intracellular studies. Anal Chem. 1981;53:2267–2269. doi: 10.1021/ac00237a031. [DOI] [PubMed] [Google Scholar]
- Borelli MJ, Carlini WG, Dewey WC, Ransom BR. A simple method for making ion-selective microelectrodes suitable for intracellular recording in vertebrate cells. J Neurosci Methods. 1985;382:159–174. doi: 10.1016/0165-0270(85)90051-2. [DOI] [PubMed] [Google Scholar]
- Boris-Moller F, Drakenberg T, Elmden K, Forsen S, Siesjö BoK. Evidence against major compartmentalization of H+ in ischemic brain tissue. Neurosci Lett. 1988;85:113–118. doi: 10.1016/0304-3940(88)90439-9. [DOI] [PubMed] [Google Scholar]
- Busa WB, Nucitelli R. Metabolic regulation via intracellular pH. Am J Physiol. 1984;246:R409–R483. doi: 10.1152/ajpregu.1984.246.4.R409. [DOI] [PubMed] [Google Scholar]
- Chesler M, Kraig RP. Intracellular pH of astrocytes increases rapidly with cortical stimulation. Am J Physiol. 1987;253:R666–R670. doi: 10.1152/ajpregu.1987.253.4.R666. [DOI] [PMC free article] [PubMed] [Google Scholar]
- Chesler M, Kraig RP. Intracellular pH transients of mammalian astrocytes. J Neurosci. 1989;9:2011–2019. doi: 10.1523/JNEUROSCI.09-06-02011.1989. [DOI] [PMC free article] [PubMed] [Google Scholar]
- Chopp M, Walton DR, Smith MB, Welch KMA. Intracellular acidosis during and after cerebral ischemia: in vivo nuclear magnetic resonance study of hyperglycemia in cats. Stroke. 1987;18:919–923. doi: 10.1161/01.str.18.5.919. [DOI] [PubMed] [Google Scholar]
- Conners BW, Bernardo LS, Prince DA. Carbon dioxide sensitivity of dye coupling among glia and neurons of the neocortex. J Neruosci. 1984;4:1324–1330. doi: 10.1523/JNEUROSCI.04-05-01324.1984. [DOI] [PMC free article] [PubMed] [Google Scholar]
- Fujiwara N, Higashi H, Shimoji K, Yoshimura M. Effects of hypoxia on rat hippocampal neurones in vitro. J Physiol. 1987;384:131–151. doi: 10.1113/jphysiol.1987.sp016447. [DOI] [PMC free article] [PubMed] [Google Scholar]
- Ginsberg MD, Welsh FA, Budd WW. Deleterious effect of glucose pretreatment on recovery from diffuse cerebral ischemia in the cat. I. Local cerebral blood flow and glucose utilization. Stroke. 1980;11:347–354. doi: 10.1161/01.str.11.4.347. [DOI] [PubMed] [Google Scholar]
- Grossman RG, Williams VF. Electrical activity and ultrastructure of cortical neurons and synapses in ischemia. In: Brierley JB, Meldrum BS, editors. Brain Hypoxia. Lippincott; New York: 1971. pp. 61–75. [Google Scholar]
- Hansen AJ, Olsen CE. Brain extracellular space during spreading depression and ischemia. Acta Physiol. 1980;108:355–365. doi: 10.1111/j.1748-1716.1980.tb06544.x. [DOI] [PubMed] [Google Scholar]
- Hertz L, Schousboe A. Ion and energy metabolism of the brain at the cellular level. In: Pfeiffer CC, Smythies JR, editors. International Review of Neurobiology. Academic Press; New York: 1975. pp. 141–21. [DOI] [PubMed] [Google Scholar]
- Jacobs MH. Some aspects of cell permeability to weak electrolytes. Cold Spring Harbor Symp Quant Bioi. 1940;8:30–39. [Google Scholar]
- Kalimo H, Rehncrona S, Soderfeldt B, Olsson Y, Siesjö BK. Brain lactic acidosis and ischemic cell damage: 2. Histopathology. J Cereb Blood Flow Metab. 1981;1:313–327. doi: 10.1038/jcbfm.1981.35. [DOI] [PubMed] [Google Scholar]
- Kraig RP, Chesler M. Glial acid–base behavior in brain ischemia. J Cereb Blood Flow Metab. 1987;7(Suppl I):S126. [Google Scholar]
- Kraig RP, Chesler M. Glia acid–base homeostasis in brain ischemia. In: Norenberg MD, Hertz L, Shousboe A, editors. Biochemical Pathology of Astrocytes. Alan R. Liss; New York: 1988a. pp. 365–376. [Google Scholar]
- Kraig RP, Chesler M. Dynamics of volatile buffers in brain cells during spreading depression. In: Somjen G, editor. Cerebral Hypoxia and Stroke: Reversible and Irreversible Effects and their Prevention. Plenum; New York: 1988b. pp. 279–289. [Google Scholar]
- Kraig RP, Nicholson C. Acidosis of presumed glia during ischemia. Soc Neurosci Abstr. 1986;12:65. [Google Scholar]
- Kraig RP, Nicholson C. Profound acidosis of presumed glia during ischemia. In: Raichle ME, Powers WJ, editors. Cerebrovascular Diseases; 15th Princeton–Williamsburg Conference; New York: Raven Press; 1987. pp. 97–102. [Google Scholar]
- Kraig RP, Petito CK. Interrelation of proton and volume regulation in astrocytes. In: Ginsberg MD, Dietrich WD, editors. Cerebrovascular Diseases; 16th Princeton–Williamsburg Conference; New York: Raven Press; 1989. pp. 239–246. [Google Scholar]
- Kraig RP, Pulsinelli WA, Plum F. Heterogeneous distribution of hydrogen and bicarbonate ions during complete brain ischemia. In: Kogure K, Hossmann K-A, Siesjo BK, Welsh FA, editors. Progress in Brain Research. vol 63. Elsevier; Amsterdam: 1985. pp. 155–166. [DOI] [PMC free article] [PubMed] [Google Scholar]
- Kraig RP, Pulsinelli WA, Plum F. Carbonic acid buffer changes during complete brain ischemia. Am J Physiol. 1986;250:R348–R357. doi: 10.1152/ajpregu.1986.250.3.R348. [DOI] [PMC free article] [PubMed] [Google Scholar]
- Lund-Andersen H. Transport of glucose from blood to brain. Physiol Rev. 1979;59:305–352. doi: 10.1152/physrev.1979.59.2.305. [DOI] [PubMed] [Google Scholar]
- Meyer FB, Anderson RE, Sundt TM, Yaksh T. Intracellular brain pH, indicator tissue perfusion, electroencephalography, and histology in severe and moderate focal cortical ischemia in the rabbit. J Cereb Blood Flow Metab. 1986;6:71–78. doi: 10.1038/jcbfm.1986.9. [DOI] [PubMed] [Google Scholar]
- Mutch WAC, Hansen AJ. Extracellular pH changes during spreading depression and cerebral ischemia: mechanisms of brain pH regulation. J Cereb Blood Flow Metab. 1984;4:17–27. doi: 10.1038/jcbfm.1984.3. [DOI] [PubMed] [Google Scholar]
- Myers RE, Yamaguchi M. Nervous system effects of cardiac arrest in monkeys. Arch Neurol. 1977;34:65–74. doi: 10.1001/archneur.1977.00500140019003. [DOI] [PubMed] [Google Scholar]
- Newman EA. High potassium conductance in astrocyte endfeet. Science. 1986;233:453–454. doi: 10.1126/science.3726539. [DOI] [PMC free article] [PubMed] [Google Scholar]
- Penfield W. Neuroglia and microglia—the interstitial tissue of the central nervous system. In: Cowdry EV, editor. Special Cytology, The Form and Function of the Cell in Health and Disease. Hoeber; New York: 1928. pp. 1033–1068. [Google Scholar]
- Petito CK, Pulsinelli WA, Jacobson G, Plum F. Edema and vascular permeability in cerebral ischemia: comparison between ischemic neuronal damage and infarction. J Neuropathol Exp Neurol. 1982;41:423–436. doi: 10.1097/00005072-198207000-00005. [DOI] [PubMed] [Google Scholar]
- Plum F. What causes infarction of ischemic brain? Neurology. 1983;33:222–233. doi: 10.1212/wnl.33.2.222. [DOI] [PubMed] [Google Scholar]
- Pulsinelli WA, Waldman S, Rawlinson D, Plum F. Moderate hyperglycemic augments ischemic brain damage: a neuropathologic study. Neurology. 1982;32:1239–1246. doi: 10.1212/wnl.32.11.1239. [DOI] [PubMed] [Google Scholar]
- Ransom BR, Carlini WG. Electrophysiological properties of astrocytes. In: Federoff S, Vernadakis A, editors. Astrocytes. vol 2. Biochemistry, Physiology, and Pharmacology of Astrocytes. Academic Press; New York: 1986. pp. 1–49. [Google Scholar]
- Rehncrona S, Rosen I, Siesjö BK. Brain lactic acidosis and ischemic cell damage: 1. Biochemistry and neurophysiology. J Cereb Blood Flow Metab. 1981;1:297–31. doi: 10.1038/jcbfm.1981.34. [DOI] [PubMed] [Google Scholar]
- Siesjo BK. Brain acid–base metabolism in health and disease. In: Bes A, Paoletti R, Siesjo BK, editors. Cerebral Ischemia. Excerpta Medica; Amsterdam: 1984. pp. 157–165. [Google Scholar]
- Smith M-L, von Hanwehr R, Siesjö BK. Changes in extra- and intracellular pH in the brain during and following ischemia in hyperglycemic and moderately hypoglycemic rats. J Cereb Blood Flow Metab. 1986;6:574–583. doi: 10.1038/jcbfm.1986.104. [DOI] [PubMed] [Google Scholar]
- Takato M, Goldring S. Intracellular marking with Lucifer Yellow CH and horseradish peroxidase of cells electrophysiologically characterized as glia in the cerebral cortex of the cat. J Comp Neurol. 1979;186:173–188. doi: 10.1002/cne.901860205. [DOI] [PubMed] [Google Scholar]
- Thomas RC. Eccentric double barrel micropipette suitable for both pHi microelectrodes and iontophoresis. J Physiol. 1986;371:24P. [Google Scholar]
- Trachtenberg M, Pollen D. Neuroglia: biophysical properties and physiologic function. Science. 1970;167:1248–1251. doi: 10.1126/science.167.3922.1248. [DOI] [PubMed] [Google Scholar]
- Von Hanwehr R, Smith M-L, Siesjö BK. Extra- and intracellular pH during near-complete forebrain ischemia. J Neurochem. 1986;46:331–339. doi: 10.1111/j.1471-4159.1986.tb12973.x. [DOI] [PubMed] [Google Scholar]
- Walz W, Hinks EC. Extracellular hydrogen ions influence channel-mediated and carrier-mediated K+ fluxes in cultured mouse astrocytes. Neuroscience. 1987;20:341–346. doi: 10.1016/0306-4522(87)90024-8. [DOI] [PubMed] [Google Scholar]
- Walz W, Mukerji S. Lactate production and release in cultured astrocytes. Neurosci Lett. 1988;86:296–300. doi: 10.1016/0304-3940(88)90499-5. [DOI] [PubMed] [Google Scholar]
- Welsh FA, Ginsberg MD, Reider W, Budd WW. Deleterious effect of glucose pretreatment on recovery from diffuse cerebral ischemia in the cat. Stroke. 1980;11:355–363. doi: 10.1161/01.str.11.4.355. [DOI] [PubMed] [Google Scholar]


