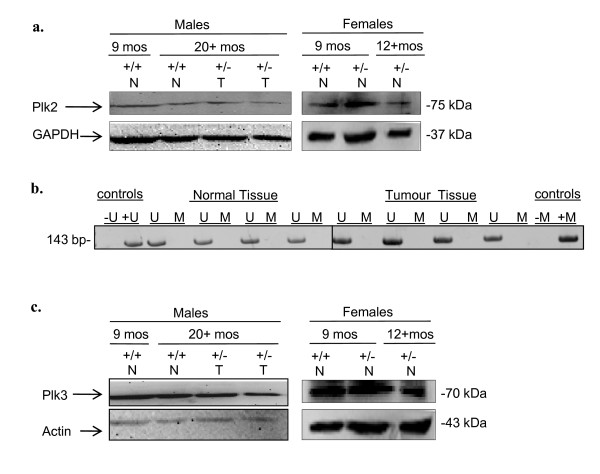
Figure 2.
Plk2 methylation of CpG island and protein expression levels for Plk2 and Plk3 in relation to both age and gender in mice. (a) Levels of Plk2 protein in liver tissue extracts as determined by Western blot analysis. (b) Plk2 CpG island methytlation status as determined by MSP analysis. (c) Levels of Plk3 protein in liver tissue extracts as determined by Western blot analysis. Shown are representative figures of 6-9 females and males for both Plk4 wild type and Plk4+/- genotypes. N = normal, T = tumour. Note: we did not analyze Plk3 for methylation status as no CpG islands were detectable for the Plk3 gene with MethPrimer.

