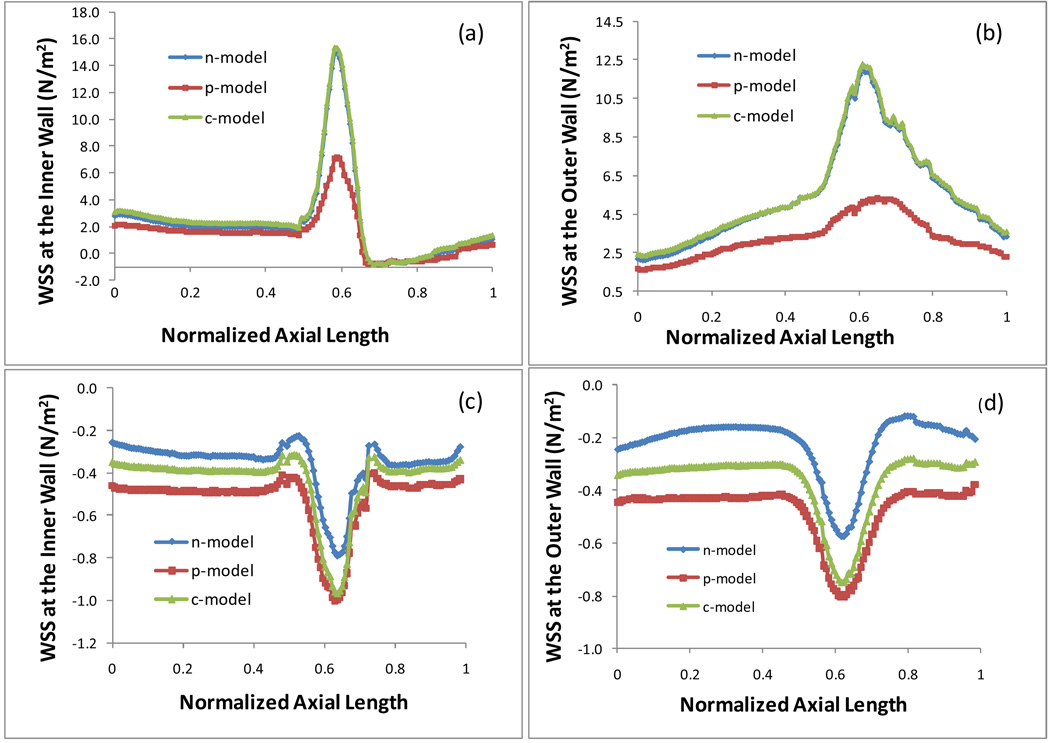
Fig. 3.
Plots of the WSS on the inner and outer wall at the maximum (t/tp = 0.85) and minimum flow rate (t/tp = 0.13) in an artery with 50% stenosis, (a) WSS on inner wall, max flow rate; (b) WSS on outer wall, max flow rate; (c) WSS on inner wall, min flow rate; (d) WSS on outer wall, min flow rate.

