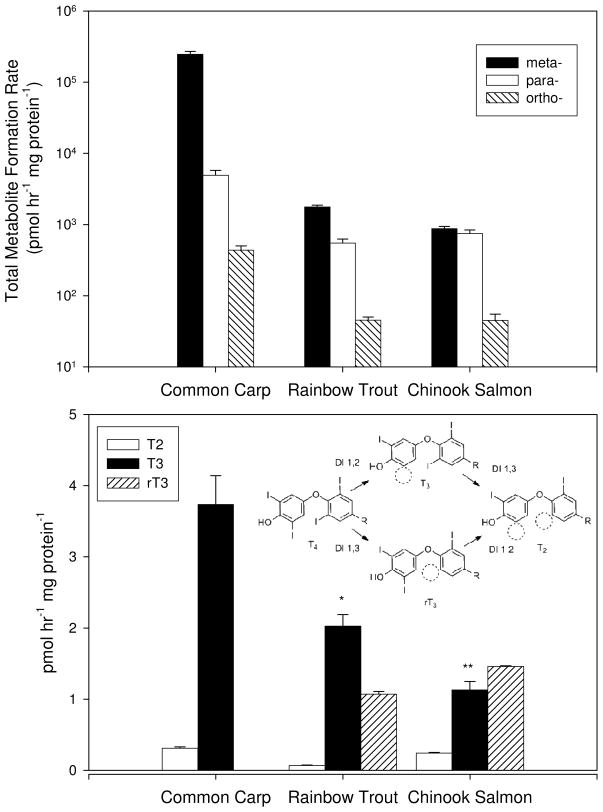
Figure 2.
Summed formation rates (fmol hr−1 mg protein−1) for all metabolites formed from BDEs 99, 153, 183, 203, 208, and 209 based on the position of debromination (top). Formation rates for 3,3′ T2, T3 and rT3 in hepatic microsomes incubated with 500 pmol of T4 and the thyroid hormone deiodination pathway (bottom). * denotes a significant difference from carp (p<0.05). ** denotes a significant difference from carp (p<0.01).

