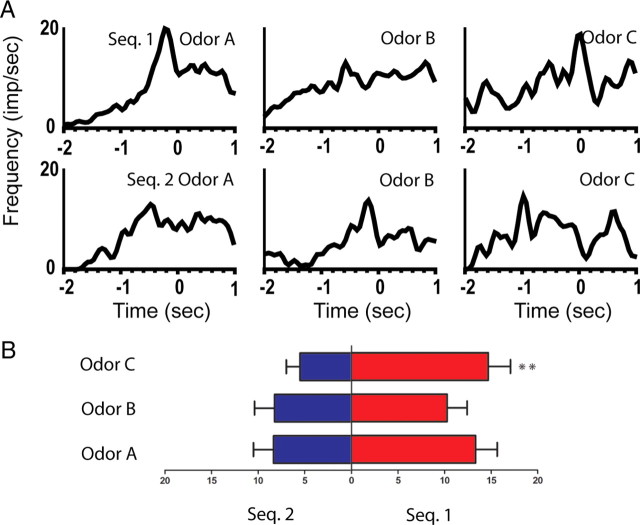
Figure 4.
An example of a splitter cell that fired differently before the presentation of the ambiguous odors during the odor-poke period. A, Line histograms illustrating the activity of cell M10–10/30.13d from 2 s before to 1 s after odor onset. Top row: average activity of the neuron to the ambiguous odors in the rewarded sequence (sequence 1; odors A–C, left to right). Bottom row: average activity to the same odors in the unrewarded sequence. This neuron showed a significant main effect of sequence. B, Summary of the average firing rate during the preodor period for the cell presented in A. Left bars indicate the mean firing rate in sequence 2, and the right bars in sequence 1. Bottom: odor A; middle: odor B; top: odor C. Post hoc analyses: *p < 0.05, **p < 0.01, ***p < 0.001.

