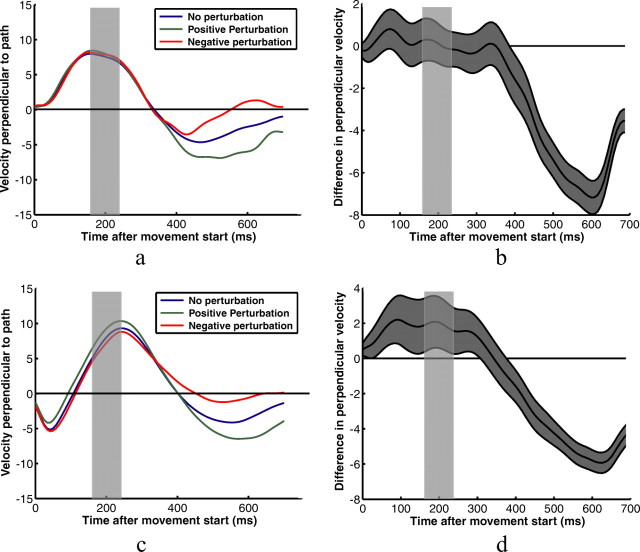
Figure 5.
Example velocity profiles for two subjects pointing to the square target. a and c show subjects' average fingertip velocities for three perturbation conditions—no perturbation, positive 1 cm perturbation perpendicular to the path between the start position and the target, and negative 1 cm perturbation perpendicular to the path. Velocities are in the direction perpendicular to the path. b and d show the average differences in perpendicular velocities for positive and negative perturbations. The gray area represents the SEM difference. The transparent gray rectangles represent the time that subjects' fingers were behind the occluder for the average trajectory. The true occlusion times varied from trial to trial.

