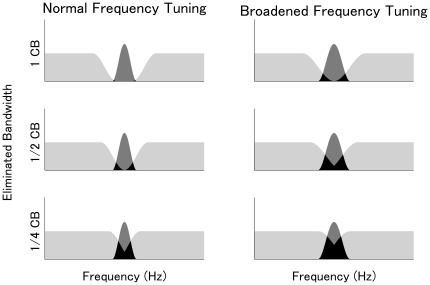
Figure 2. Models of population-level frequency tuning.
Left and right columns represent schematic illustrations of normal and broadened population-level frequency tuning. The three differently colored areas represent, (i) neural activity elicited merely by band-eliminated noises (BEN: light gray areas), (ii) neural activity elicited merely by test pure tones (TS: dark gray areas), and (iii) neural activity elicited by both BEN and TS (black areas). The rows represent wide (top: 1 critical band (CB)), middle (medium: 1/2 CB), and narrow (bottom: 1/4 CB) BEN conditions. The dark gray areas represent the N1m response amplitude as elicited by the TS-onset; the neural activity represented by the black areas has been masked by the simultaneously presented (but earlier on-setting) BEN. Notably, the dark gray areas (i.e., N1m amplitudes evoked by the TS) are less influenced by the eliminated bandwidths in case of normal frequency tuning compared to broadened frequency tuning, especially in the narrow BEN condition.

