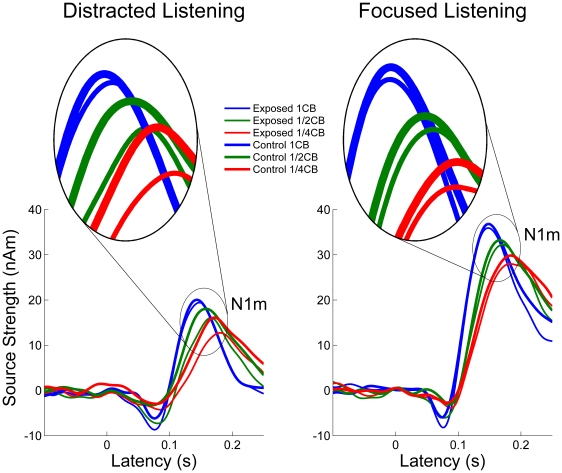
Figure 3. Source strength waveforms.
Grand averaged source strength waveforms for each experimental condition. Left and right panels represent the distracted and focused listening conditions, respectively. Thin and thick lines represent the portable music player (PMP) exposed and the control groups. Color codes band-eliminated noise (BEN) condition (blue = 1 critical band (CB), green = 1/2 CB, red = 1/4 CB). All source strength waveforms depicted clear N1m responses, which are further magnified in the ellipsoids. N1m source strengths were overall larger in the focused listening than in the distracted listening condition.

