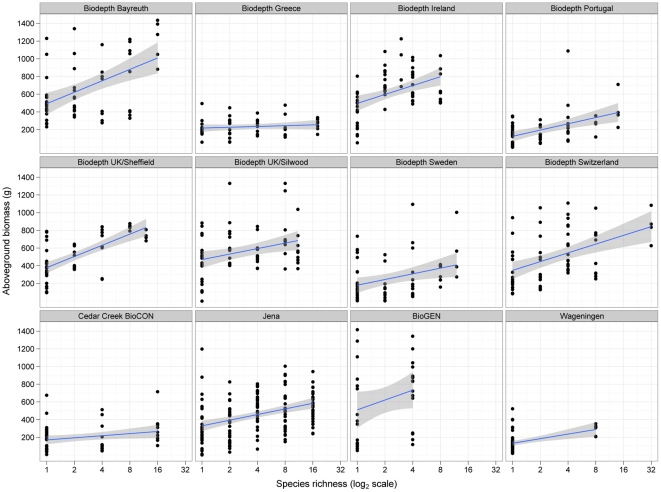
Figure 1. Regression slopes from the least squares mixed-model ANOVA.
The response of aboveground annual net primary productivity to manipulations of species richness in each of the 12 grassland biodiversity experiments showing data for individual plots and fixed effects regression slopes fitted for each experiment with their 95% confidence intervals.

