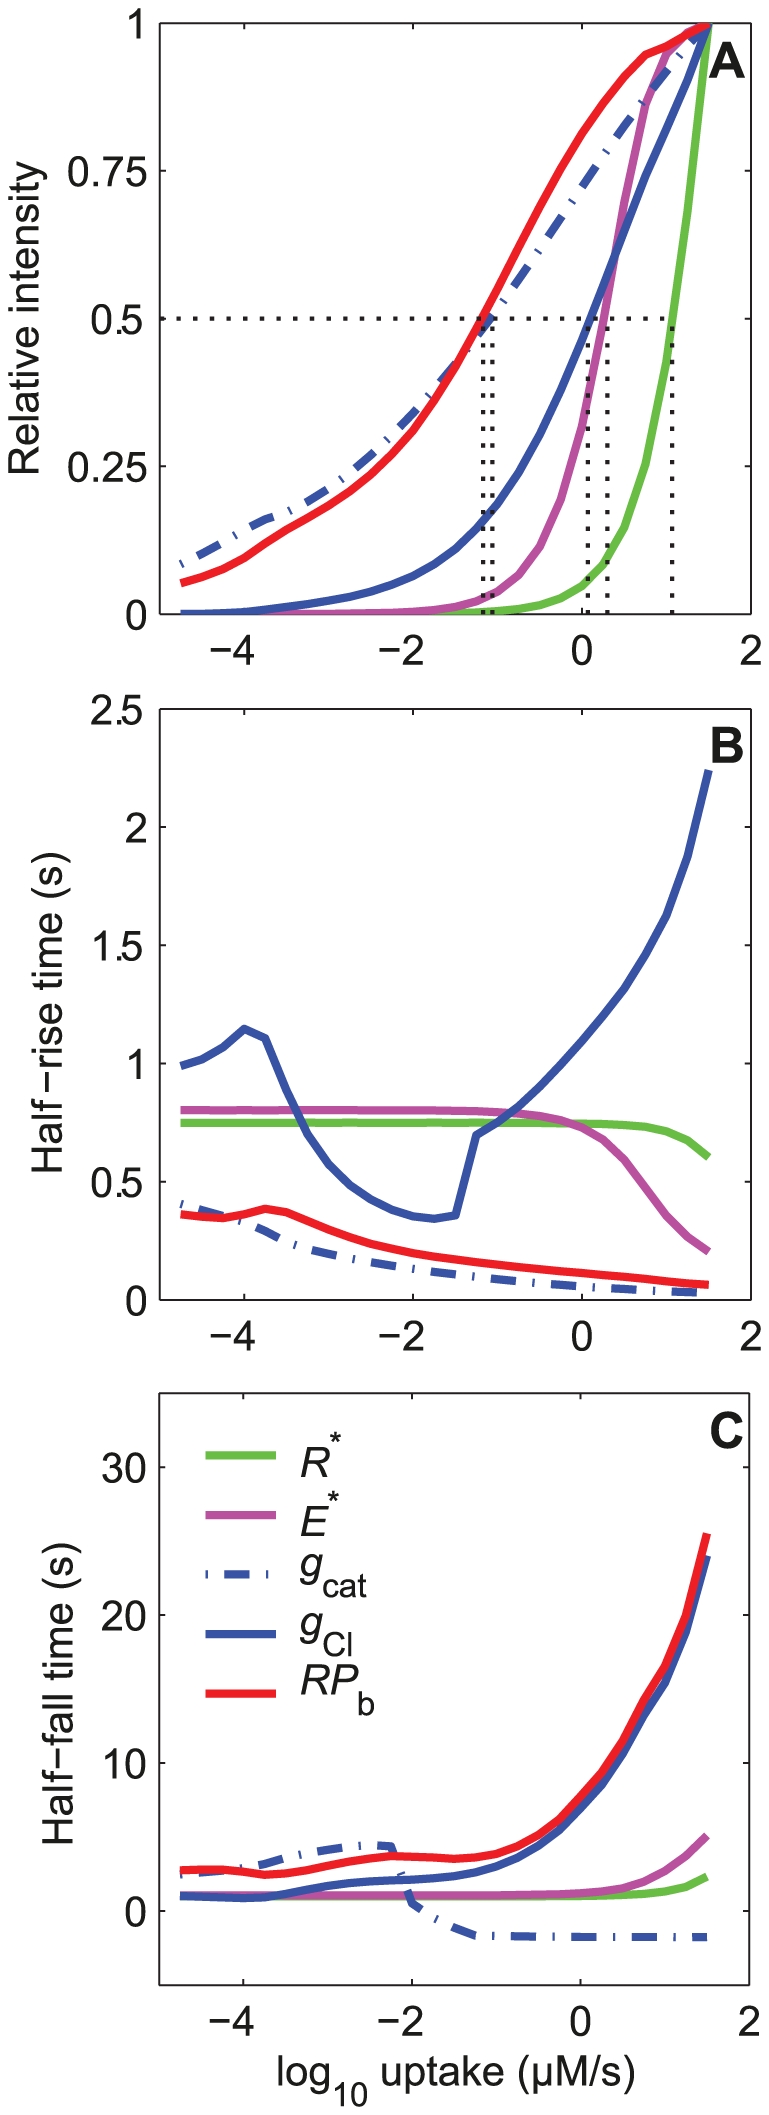
Figure 7. Dose-response characteristics of the major steps in the pheromone transduction cascade.

(A) Relative heights of activated pheromone receptor R* (green), effector enzyme E* (magenta), conductance of cationic and chloride channel at the dendrite g cat (dash-dotted blue) and g Cl (solid blue), and receptor potential at the dendrite base RP b (red) as a function of stimulus uptake. The EC50's of R* (11.75), E*(2.0), g cat (0.0871), g Cl (1.175) and RP b (0.069) are indicated (in µM/s). (B) Half-maximum rising times; at EC50's they are 0.70 s (R *), 0.68 s (E *), 0.08 s (g cat), 1.15 s (g Cl) and 0.16 s (RP b). (C) Half-maximum falling times; at EC50's they are 1.40 s (R *), 1.35 s (E *), −1.6 s (g cat), 7.9 s (g Cl) and 3.70 s (RP b). It becomes negative for g cat when it declines before the end of the 2-s stimulation (falling times are determined from the end of stimulation). The curves for RPb are the same as in Fig. 5. The differential equations and data for R* and E* are the same as in [18], the corresponding parameter values are given in [46] for R* and [49] for E*.
