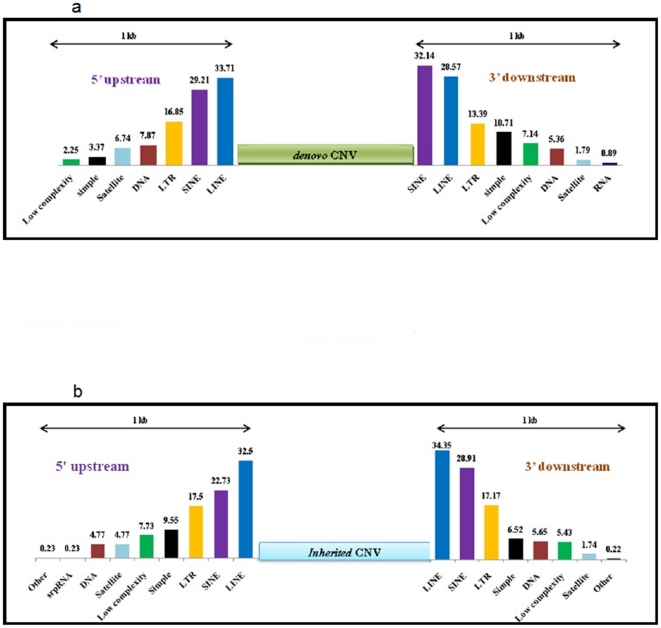
Figure 2. Distribution of repeat elements 1 kb upstream (5′) and 1 kb downstream (3′) of the de novo (2a) and inherited (2b) CNVs across eight individuals.
These include LINE (blue), SINE (purple), LTR (yellow), Satellite (sky blue), simple repeats (black) and low complexity repeats (green) with numerical values on top of the bars representing percentage of that repeat.

