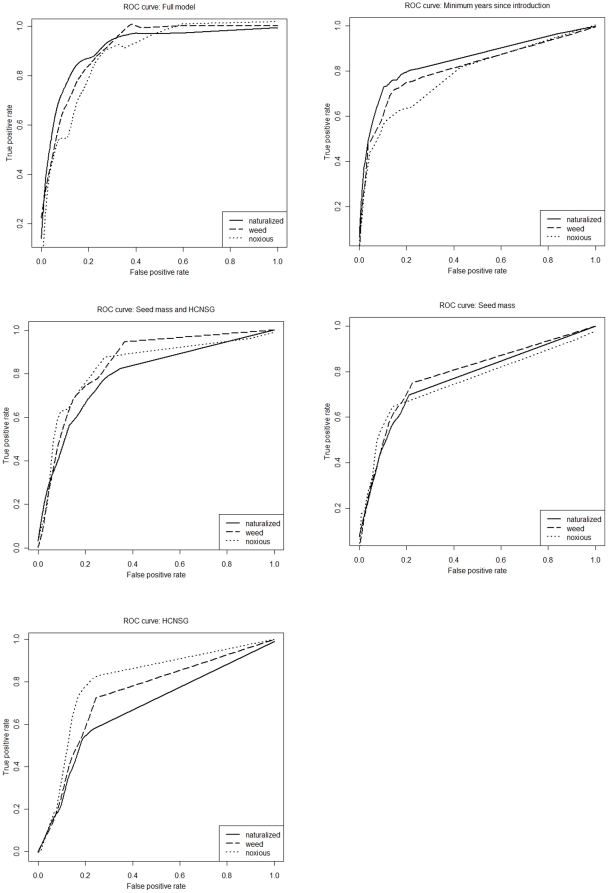
Figure 2. ROC curves showing performance of classifiers for each model.
Performance is shown for naturalized, weed, and noxious species from all introduced species as a function of 1) minimum years since introduction, seed mass, and HCNSG, 2) minimum years since introduction, 3) seed mass and HCNSG, 4) seed mass, and 5) HCNSG in discriminating. Increased area between the ROC curve and the diagonal indicates improved classifier performance. Curves were smoothed using the lowess function in the stats package of R.

