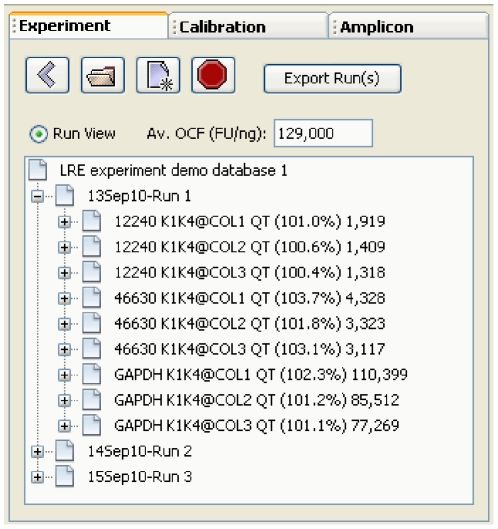
Figure 3. The explorer panel contains three windows for viewing of data within the three LRE databases.
In this screenshot, the demonstration experiment database has been opened, which contains data generated by three runs conducted over 3 days, with the first run expanded to show nine average sample profiles. The sample profile labels are generated using the template: <“amplicon name” @ ”sample name” (Emax) # target molecules>, and illustrate the primary output of the LRE Analyzer, which is the automated determination of the number of target molecules within a sample. In this example, transcript quantities have been determined for three genes (12240, 46630 and GAPDH) within three replicate reverse transcriptase reactions (COL1-3).

