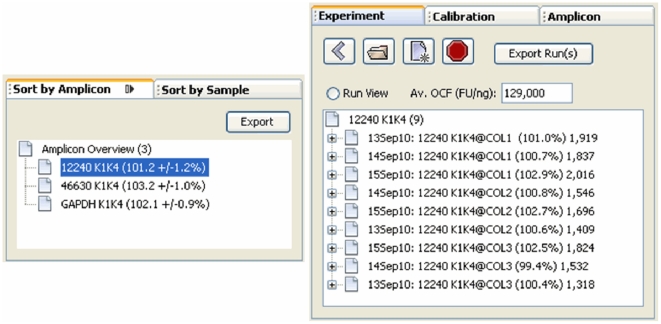
Figure 5. The sorting panel allows profiles to be organized by either amplicon or sample.
These windows become active whenever the experiment or calibration explorer window is active. Selection of either an amplicon or sample (an amplicon in this example) will generate a list of all profiles within the database (an experiment database in this example) generated with that amplicon or sample. This in turn allows profiles generated across multiple runs to be viewed/edited or exported as a group. Note that selecting the “Run View” button within the experiment explorer window will restore the run-based tree view. Note also that the sorting windows can be iconized using the button located in the upper right side of each window. Placing the mouse over either of the iconized windows will trigger the respective window to fly out, allowing an item to be selected. Selecting an item in the explorer window will then trigger retraction of the sorting window, providing a convenient method for accessing the sorting windows while reducing the overall size of the main window.

