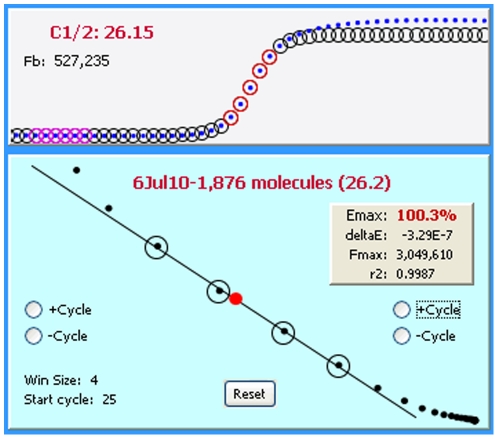
Figure 10. An example of plateau drift.
A common form of kinetic distortion, referred to as “plateau drift”, is produced by a continued increase in amplicon DNA quantity beyond that predicted by the LRE model, which is represented as circles within the upper panel (referred to as the FC plot). This is particularly evident in the LRE plot (lower panel) as a progressive drifting of points above the LRE line. Importantly, inclusion of these aberrant cycles in the LRE window (represented by the black circles in the LRE plot and the red circles in the FC plot) will generate an underestimation of Emax (Y-intercept) that leads to an overestimation of target quantity.

