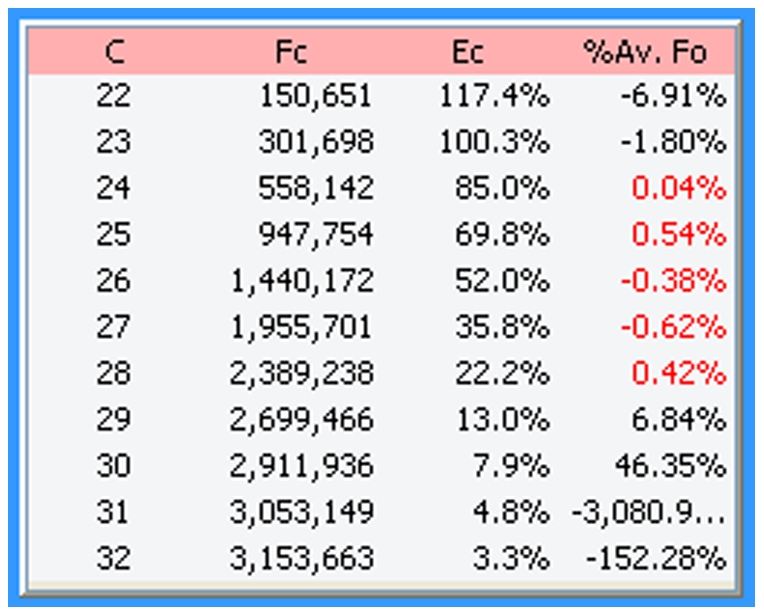
Figure 11. The tabular summary provides values for the three parameters that define a cycle.

C: cycle number, FC: the fluorescence reading, EC: the cycle's amplification efficiency, %Av. Fo: the percent difference between the cycle F0 and the average F0 generated by the cycles within the LRE window (designated by the red font). In this example, the F0 threshold (Figure 9) was set to 6% so that cycle 29, which generated a 6.84% difference, triggered termination of LRE window expansion at cycle 28.
