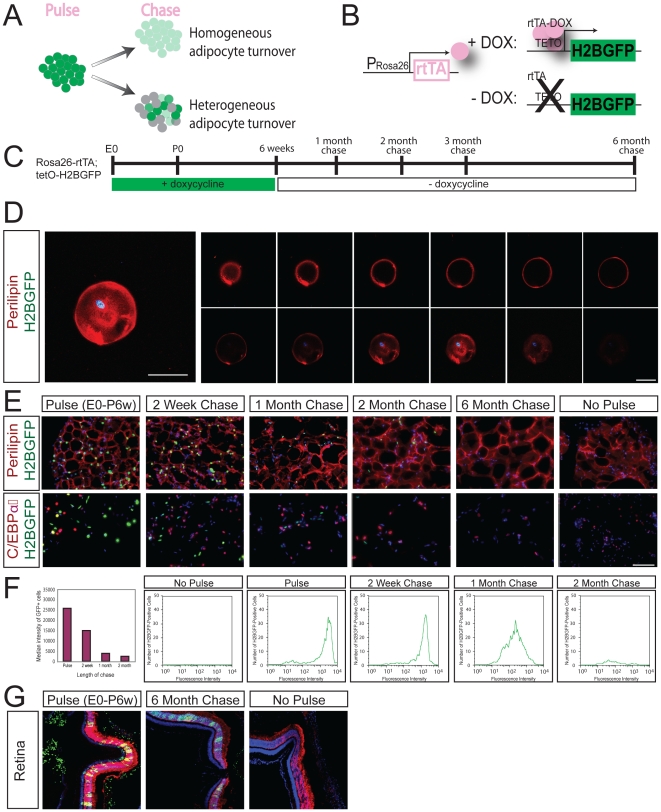
Figure 1. Rapid adipocyte turnover in adipose tissue.
A. Schematic showing how Rosa26-rtTA; tetO-H2BGFP pulse-chase dilution can distinguish between homogeneous adipocyte turnover (all adipocytes show loss of H2BGFP florescence) and heterogeneous adipocyte turnover (some adipocytes show loss of H2BGFP florescence, others maintain H2BGFP florescence). B. Experimental schematic for Rosa26-rtTA; tetO-H2BGFP expression. C. Timeline for Rosa26-rtTA; tetO-H2BGFP pulse-chase experiments. D. H2BGFP (green) is detected in the nucleus of single murine adipocytes expressing perilipin (red) and DAPI (blue). Scale bars 50 µm. E. Uniform loss of label in adult adipocytes following pulse-chase with Rosa26-rtTA; tetO-H2BGFP following a chase period of up to 6 months. Top row, Perilipin (red), DAPI (blue). Bottom row, CEBPα (red), DAPI (blue). No adipocytes are labeled in the absence of pulse. Exposure matched images. Scale bars 100 µm. F. FACS histograms of dissociated adipocytes of Rosa26-rtTA; tetO-H2BGFP pulse-chase animals are presented as number of H2BGFP-positive cells versus fluorescence intensity. Median fluorescence intensity of GFP-positive cells versus length of chase shown in graph. G. Even after six months of chase, LRCs were detected in the post-mitotic photoreceptor cells of the retina after expression of Rosa26-rtTA; tetO-H2BGFP from E0-6weeks. H2BGFP expression (green), recoverin (red), DAPI (blue). Magnification 200x. All images are exposure matched.

