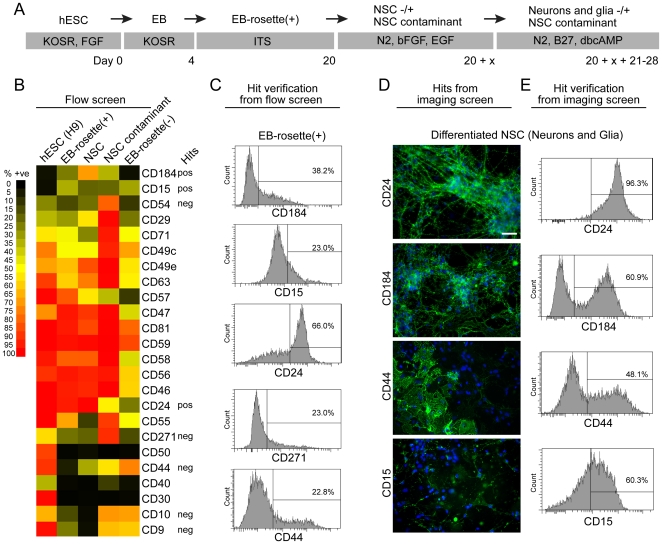
Figure 1. Cell surface marker screen of cell cultures at distinct phases of SFEB neural induction of H9 hESC.
(A) Diagrammatic representation of the SFEB neural induction and isolation of NSC (see Methods for details). EB = embryoid body(ies); EB-rosette(+) = EB at a stage of differentiation when columnar rosettes are present in many EB; NSC = neuronal stem cells expanded from rosettes that were handpicked from EB-rosette(+); NSC contaminant = culture of intermittent contaminant of handpicked and expanded NSC cultures. (B) Heat map showing percent positive (% +ve) of representative cell surface markers in a FACS-based screen. EB-rosette(-) = EB depleted of rosettes. Markers identified from the screen to be potential positive (pos) or negative (neg) selection candidates (Hits) are noted. (C) Examples of intensity distributions of EB-rosette(+) cultures stained with candidate cell surface markers. The percentage reflects the population in the “positive” population for each marker. (D) Examples of an image screen of cell surface markers on neuron enriched cultures induced to differentiate from NSC for 3 weeks. CD24 clearly stains neurons whereas CD44, and CD15 do not. CD184 appears to stain some neurons and other cell types. (E) Same as c but with neuron-enriched cultures induced to differentiate from NSC. Scale bar is 50 µm.

