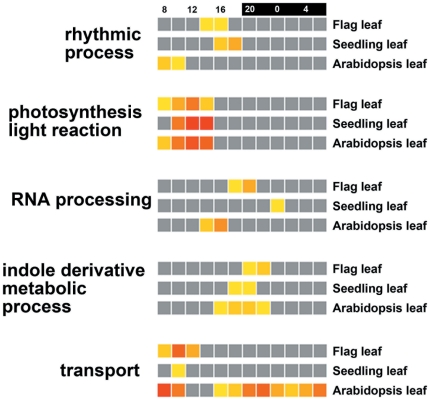
Figure 7. Selected GO term distribution along with the phase of the diurnal pattern between Arabidopsis and rice leaves.
The comparison is displayed in HTML table mode for rice flag leaf, rice seedling leaf, and Arabidopsis leaf. The color blocks (yellow-to-red) represent the level of each term at a certain time-point. The greyscale represents non-significant enrichment.

