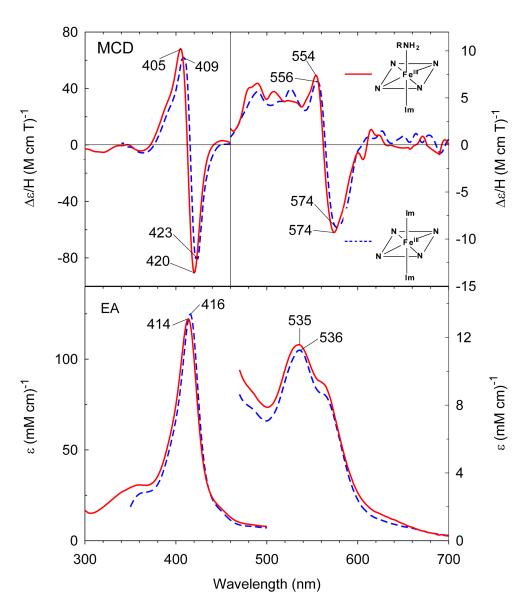
Figure 5.
MCD (top) and electronic absorption (bottom) spectra of cyclohexylamine and Im-bound ferric H93G Mb (0.2 mM Im, 1 M cyclohexylamine) (solid line) compared to and previously reported bis-Im-bound ferric H93G(Im) Mb (2 M Im) (dashed line).28 The spectra were recorded in 0.1 M potassium phosphate at pH 7.0 at 4 °C.

