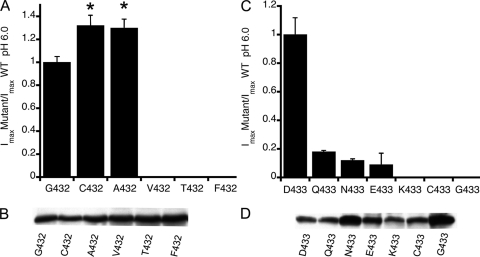
Figure 1.
Relative magnitude of whole cell currents evoked by pH 6.0 of mutants in positions Gly-432 and Asp-433. (A) Normalized currents of Gly-432 substitutions. Columns are the average of ≥12 cells from three different preparations. Error bars are standard deviations. Asterisks indicate significant difference from G432 by unpaired t test, P ≤ 0.005. (B) Western blot of lASIC1 detected with anti-FLAG monoclonal antibody from eight oocytes injected with 5 ng cRNA that were biotinylated after measurements of whole cell currents by TEVC. (C) Normalized currents of substitutions of Asp-433. (D) Western blot of oocytes as shown in C, but oocytes expressing N433 and G433 were injected with 50 ng cRNA.

