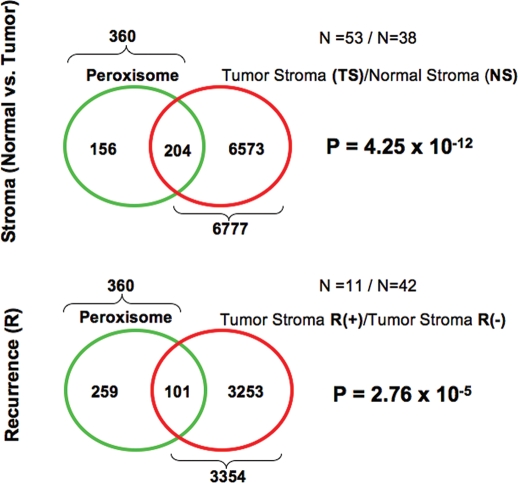
Figure 5.
Venn diagrams for the transcriptional overlap between peroxisomes and tumor stroma from breast cancer patients. Upper panel, overlap with tumor stroma. Note the overlap of 204 genes with a p value of 4.25 × 10⁻¹². Lower panel, overlap with “recurrence-prone” stroma. Note the overlap of 101 genes with a p value of 2.76 × 10⁻⁵.

