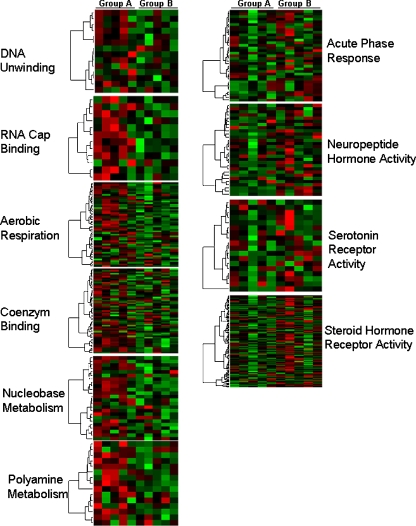
Fig. 2.
Functional and pathway classification of the differentially expressed genes. Columns represent the gene expression levels of osteoblastic osteosarcoma patients (group A) and non-osteoblastic osteosarcoma patients (group B). Gene expression profile through pathway analysis demonstrates that genes involved in nucleobase- and polyamine metabolism and aerobic respiration were up-regulated in osteoblastic osteosarcoma patients (group A). Genes involved in steroid- and neuropeptide hormone receptor activity, acute-phase response and serotonin receptor activity were upregulated in non-osteoblastic osteosarcoma patients (group B). Each row represents a gene, and patient samples are depicted in columns. Red indicates genes that are expressed at higher levels. Green indicates genes that are expressed at lower levels compared with mean expression

