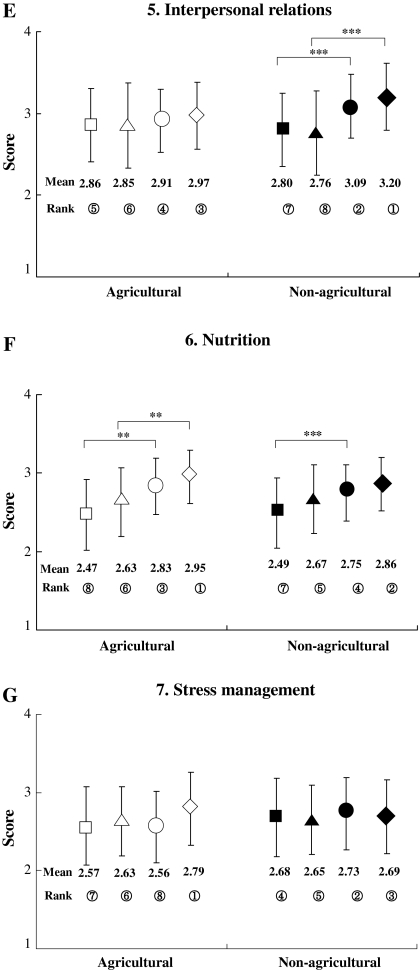
Fig. 1.
Mean overall Health Promoting Lifestyle Profile (HPLP)-II scores (a) and mean scores for the HPLP-II subscales (b-g), as well as rank orders (a-g) for agricultural (n = 130) and non-agricultural groups (n = 497). Data are means ± SD. Statistical analysis was performed by the Bartlett test of one-way analysis of variance. Significant differences between corresponding groups are indicated as follows: *p < 0.05, **p < 0.01, ***p < 0.001. Numbers in circles ①-⑧ indicate the rank order of each score in each group. Symbols for the agricultural group are as follows: open squares young-male, open triangles old-male, open circles young-female, open diamonds old-female. Symbols for the non-agricultural group are as follows: filled squares young-male, filled triangles old-male, filled circles young-female, filled diamonds old-female


