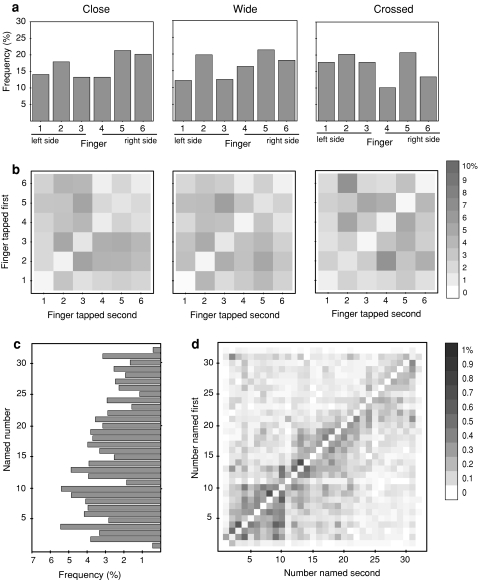
Fig. 2.
a Bar charts showing for all of the conditions the percentage of trials in which each finger was tapped. b The percentage of switches between one finger to another finger for all possible finger combinations. The squares on the diagonal indicate tapping the same fingers twice in a row. c The bar chart shows the percentage of trials in which a certain number was named averaged over all conditions. d The matrix indicates the percentage of trials in which two numbers were named subsequently for all possible number combinations averaged over all conditions. The squares on the diagonal indicate naming the same number twice in a row

