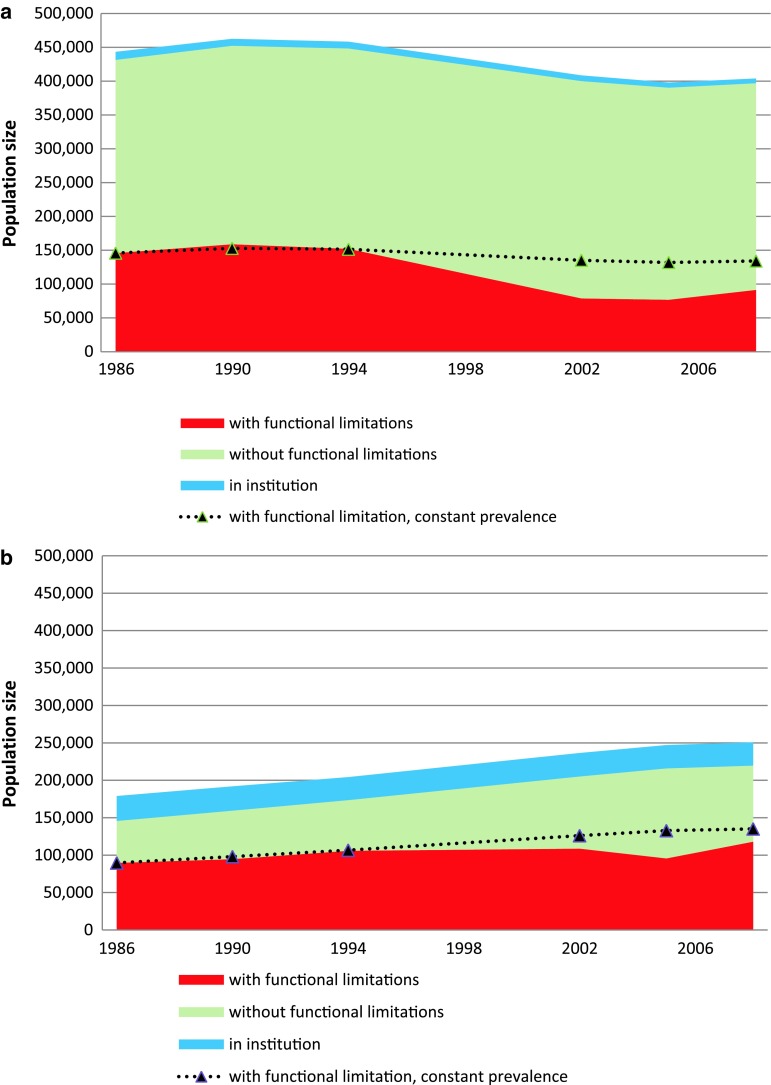
Fig. 3.
Number of older adults in institutions and estimated numbers with and without functional limitations. The dotted lines depict the number that would have reported functional limitations if the proportion with such limitations remained constant at 1986 level throughout the period. a Age 67–79 years. b Age 80 years and older

