
Figure 2.
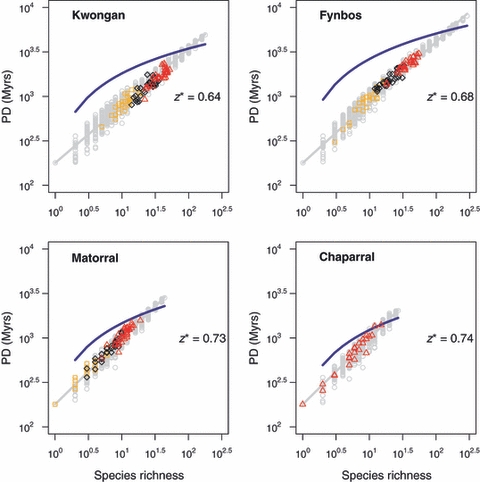
Species–phylogenetic diversity (PD) curves in Mediterranean-type ecosystems. The grey circles report, for each value of species richness (S), the PD of 100 communities obtained by randomly sampling S species across the tips of each phylogeny (species–PD relationship). This relationship is well fit by a power law in the four phylogenies (eqn 1, plain grey line). In particular, the power-law fit is much better than the best-fit logarithm (in blue). The intercept of both fits is constrained by the age of the most recent common ancestor, T0. The species–PD curve corresponding to the combined dataset is also power law, with z* = 0.71 (Figure S3). Coloured data points correspond to actual communities. Orange squares: communities sampled at the 2.5 × 2.5 m scale; black diamonds: communities sampled at the 7.5 × 7.5 m scale; red triangles: communities sampled at the 20 × 20 m scale. Most communities are not significantly different from randomly assembled communities (see Appendix S2 for details).