
Figure 4.
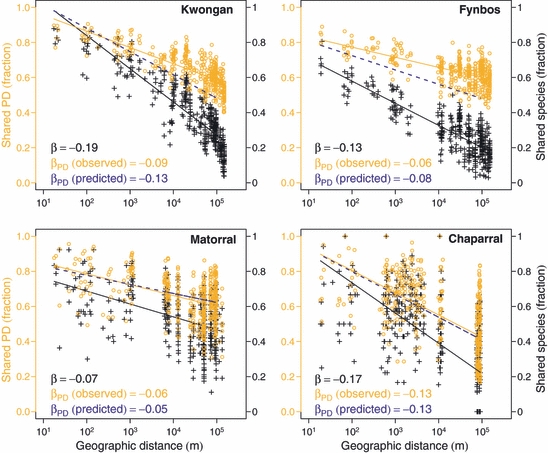
Decay in phylogenetic similarity with geographic distance within Mediterranean-type ecosystems. The observed phylogenetic distance–decay relationship (in orange: circles, data; line: logarithmic fit) can be approximated by expectations (eqn 6, in blue) obtained by simple transformation of the classical distance–decay relationship for species turnover (in black: crosses, data; line: logarithmic fit). The rate of decay in phylogenetic similarity (βPD) is significant in all four datasets (mantel test, P< 0.001). This rate is lower than the rate of decay in taxonomic similarity (β), and the difference is the largest in floras where species are the least phylogenetically distinct (i.e. in the kwongan and fynbos).