
Figure 1. Playback experiments with mice.
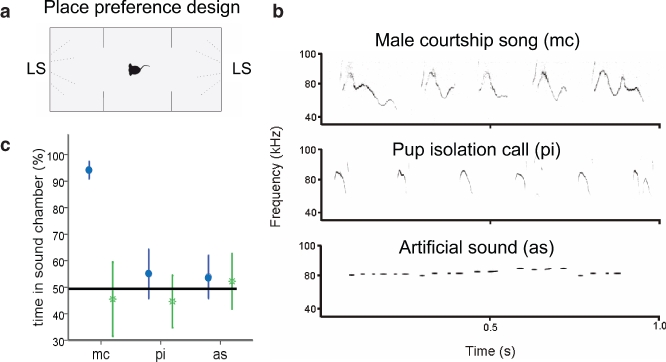
(a) Sketch of place preference design. LS = loudspeaker. In the two trials, females were presented with songs from different males, all of which were unfamiliar. (b) Spectrograms of playback sounds. (c) Percentage of time the females spent in the chamber with the playback sound (mean ± SEM). Line indicates chance level. Filled squares = first presentation, open squares = second presentation (N = 32) (figure adapted from Hammerschmidt et al. 2009).