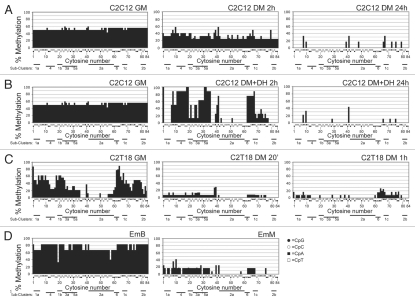
Figure 2.
Summary of methylation percentages of all C moieties and all experimental conditions. The x-axis shows the 84 C moieties of the myogenin 5′-flanking region analyzed. The y-axis represents the percentage of methylation of each C. Only the experiments with controls of bisulphite modification (see Materials and Methods) with correct patterns were taken into account. The kind of CpN is indicated below the x-axis, according to the legend. The sub-cluster positions are indicated at the bottom of each graph.

