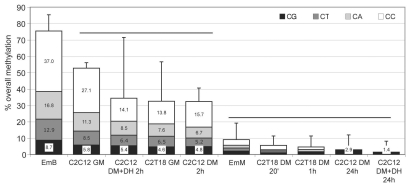
Figure 3.
Overall methylation of CpG and non-CpG moieties. Cytosines were partitioned (from bottom to top of each bar) in CpG (black area), CpT (dark gray area), CpA (light gray area) and CpC (white area) moieties. For each experimental condition, the overall percentage of each CpN methylation (of the first C for CpC) is shown in the corresponding bar area; the sum of all CpN methylation is indicated by the total bar height and corresponds to the overall methylation percentage of all C; sd are also indicated. The overall differences are highly significant (ANOVA p < 0.0001). The heavy horizontal black lines group together the experimental conditions with overall methylation that was not statistically different (as evaluated by Bonferroni's t-test).

