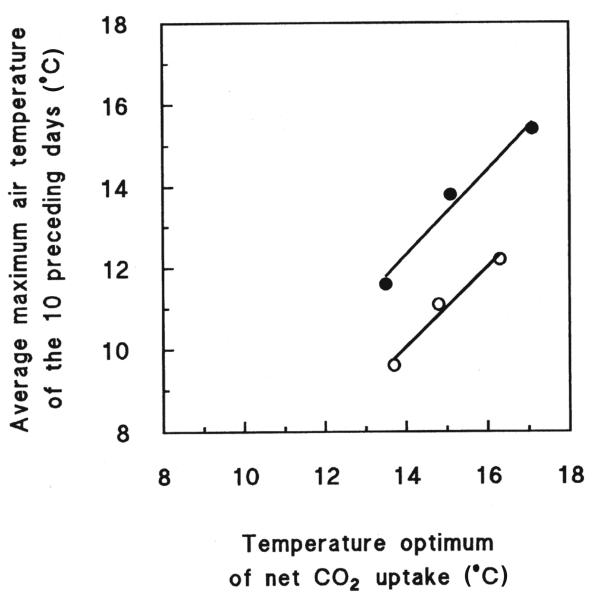
Figure 3.
The relationship between the temperature optimum at which maximum net CO2 uptake occurred and the average maximum air temperature of the 10 days preceding the measurements obtained in fall (open symbols) and summer (closed symbols). Points were fit by linear regression: fall: y = 0.98x − 3.7, r2 = 0.97; summer: y = 1.05x − 2.3, r2 = 0.98.

