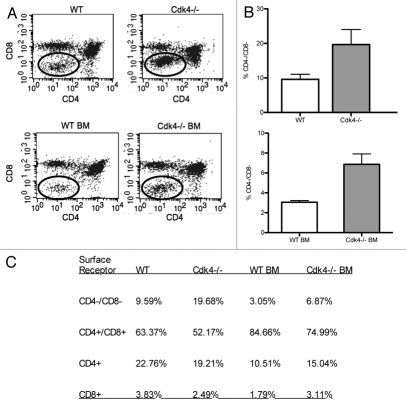
Figure 2.
Cdk4−/− mice have increased CD4/CD8 double negative thymocytes. (A) Representative scatter plots of thymocytes from wt and Cdk4−/− mice (top) and wt or Cdk4−/− bm chimeras (bottom) stained with anti-CD8 (y-axis) and anti-CD4 (x-axis). (B) Percentage of CD4/CD8 double negative thymocytes. Top: n = 6/group, Bottom: bm chimeras n = 2/group. Means ± SD are shown. *p < 0.05. (C) Summary of flow cytometric analysis of thymocyte subsets.

