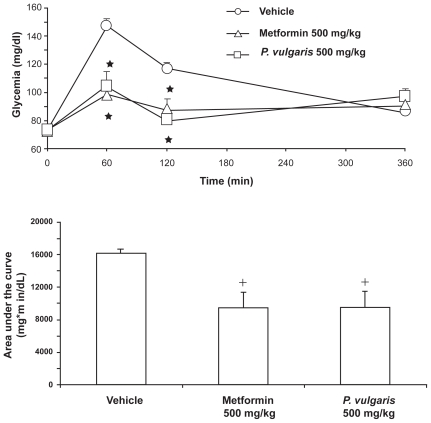
Figure 5.
Similar reducing effect of a Phaseolus vulgaris extract and metformin on time-course of glycemia (top panel) and area under the curve of the time-course of glycemia (bottom panel) in Wistar rats given a 1-hour (corresponding to the 0- to 60-minute time interval) access to a starch-enriched diet and water. Each point or bar is the mean ± SEM of n = 7 to 8 rats. ANOVA results – Time-course: Ftreatment (2,20) = 9.13, P < 0.005; Ftime (2,40) = 21.95, P < 0.0001; Finteraction (4,40) = 10.95, P < 0.0001; Area under the curve: F (2,20) = 7.23, P < 0.005. *P < 0.005 with respect to values of vehicle-treated rats at the same time interval (Newman-Keuls test); +P < 0.05 with respect to values of vehicle-treated rats (Newman-Keuls test).

