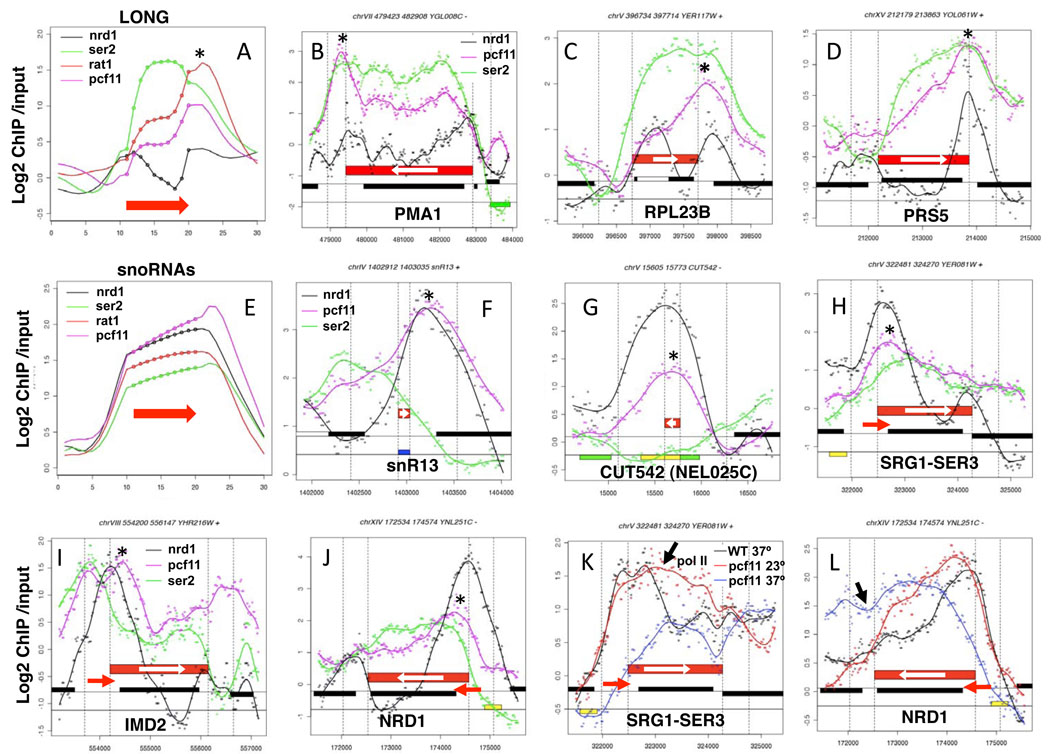
Figure 6. Termination factors Pcf11 and Nrd1 at 3’ ends.
A. Average distributions of Nrd1, S2-PO4, Rat1 and Pcf11 across long ORFs as in Fig. 1. Note coincident peaks of Nrd1, Pcf11 and Rat1 at 3’ ends (*) (see also Supp. Figs. 6E, F).
B–D. Plots of ChIP signals on selected genes showing discrete peaks of Nrd1 and Pcf11 accumulation (*) at poly (A) sites.
E. Average distributions of Nrd1, S2-PO4, Rat1, and Pcf11 across snoRNAs as in A.
F, G. Co-localization of Pcf11 with Nrd1 (*) on a snoRNA and a CUT.
H–J. Recruitment of Pcf11 and Nrd1 (*) to regulatory ncRNAs (red arrows) overlapping the 5’ ends of SER3, IMD2 and NRD1.
K, L. Effects of Pcf11 inactivation on transcription of SER3 and NRD1 with ncRNAs at their 5’ ends. Total pol II in WT (black) and pcf11-9 (PMY518) at 23° (red) and 37° (blue). Apparent readthrough transcription signals in pcf11-9 are marked with black arrows (see also Supp. Fig. 7E, F).

