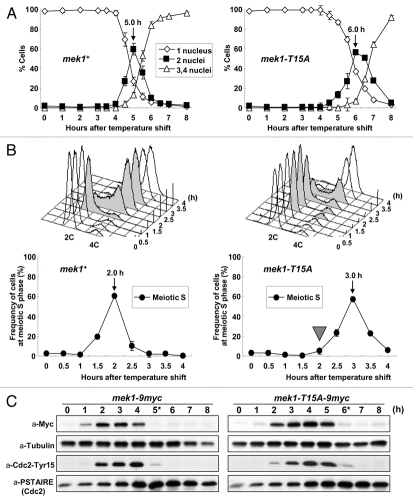
Figure 3.
Meiotic progression is delayed in mek1-T15A-9myc pat1 cells. (A) Meiotic progression was monitored by counting nuclei following the induction of meiosis at the indicated times in mek1+ cells, mek1-9myc pat1 cells (TT305) and mek1-T15A-9myc pat1 cells (TT273). The data are the means ± SD of at least three independent experiments. (B) Progression of meiotic S phase was monitored by FACS analysis of the DNA content of samples collected at each time point (upper parts). The fraction of cells undergoing DNA replication at each time point was determined from the FACS profiles with Modfit LT software (lower parts). (C) Western blot detection of Mek1-9myc, α-Tubulin, Tyr15 phosphorylated Cdc2 and total Cdc2. Samples were taken after the temperature shift at the indicated times. α-tubulin was used as a loading control. Asterisks show the time at which the number of cells possessing two nuclei peaked.

