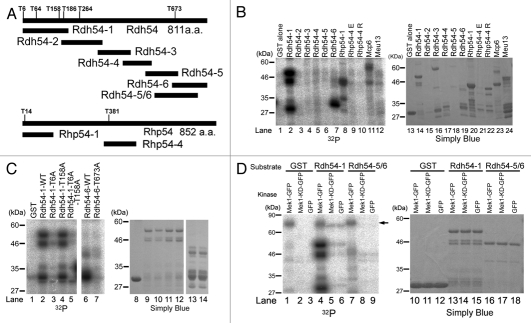
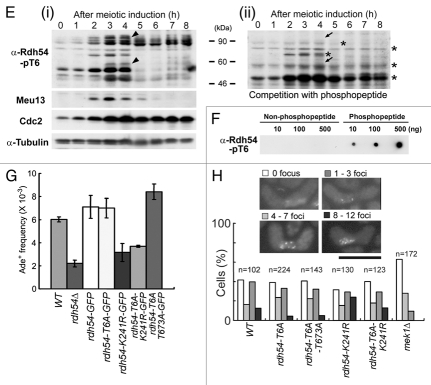
Figure 6.
Mek1 phosphorylates Rdh54 on T6 and T673. (A) Schematic presentation of the RXXT site and the fragment map of Rdh54 and Rhp54 derivatives that are expressed as N-terminal GST-fused proteins. (B) Left part, Mek1 kinase assay performed in vitro with Mek1-GFP immunoprecipitates from mitotic S. pombe cells and the GST-fused Rdh54 and Rhp54 fragments, and Mcp6 and Meu13 proteins as substrates. Right part, Simply Blue staining of an SDS-PA gel shows a loading control. (C) Mek1 kinase assay performed in vitro with GST-fusion Rdh54 truncated proteins with/without point mutations, in which T6, T158 and/or T673 were replaced with alanine. (D) Mek1 kinase assay performed in vitro with immunoprecipitates of Mek1-GFP (positive control), Mek1-KD-GFP (kinase-dead form) or GFP (negative control), and truncated GST-fused Rdh54-1 or Rdh54-5/6 fragments or GST alone as substrates. The arrow indicates autophosphorylation of Mek1. (E) Western blot analysis conducted during S. pombe meiosis using an anti-Rdh54-pT6 antibody in the absence (i) or presence (ii) of a phosphopeptide (KRRApTFQCPLIEC) that was used as an antigen. The h−/h− pat1-114 mug28+-3HA strain was induced to enter meiosis synchronously by a temperature shift, and cells were collected at 1 h intervals for protein extraction, blotting and probing with the anti-Rdh54-pT6 antibody. Tilted arrowheads in (i) indicate putative Rdh54-pT6 bands that disappeared after a competition experiment, in which the phosphopeptide was incubated with the antibody before probing the western blot, as indicated by tilted arrows in (ii). Asterisks indicate putative nonspecific bands that were not weakened after peptide competition. Meiotic expression of Meu13 was analyzed to identify the meiotic stage at each time point. Cdc2 and α-tubulin levels were examined as loading controls. (F) Dot blot analysis indicates that the anti-Rdh54-pT6 antibody recognized the phosphopeptide that was used as an antigen, but not the non-phosphopeptide (KRRATFQCPLIEC). (G) Gene conversion rates involving ade6-M26 and ade6-469 on chromosome III were measured in rdh54 point mutants. The bar graph with error bars shows the average ± SD values of three independent experiments. (H) Observation of Rdh54 nuclear foci in rdh54 mutant cells and the mek1Δ strain. The rdh54-WT (TK118-WTG), rdh54-T6A (TK118-T6A-1), rdh54-T6A/T673A (TK201-1), rdh54-K241R (TK119-K241R-1), rdh54-T6A/K241R (TK118-T6A/K241R-1) and mek1Δ (TK123) cells induced to enter meiosis were analyzed by fluorescence microscopy for Rdh54-GFP (green). Typical images are shown in the upper parts. Scale bar: 10 µm. The bar graph shows the frequency of cells with 0, 1–3, 4–7 or 8–12 Rdh54-GFP foci at the horsetail phase.


