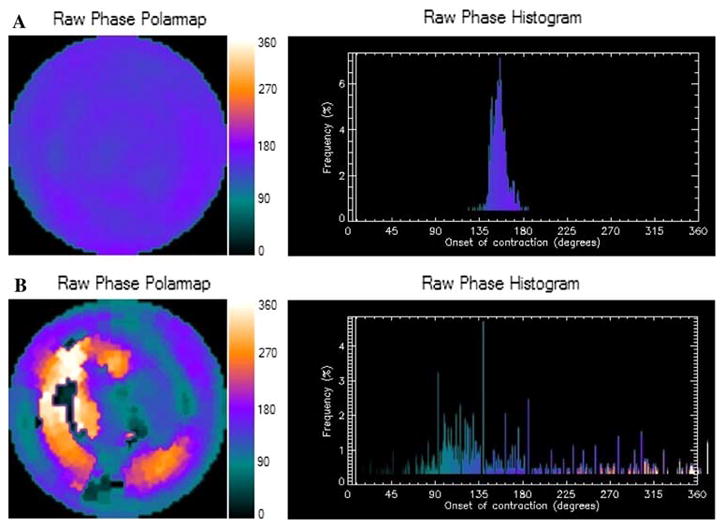
Figure 1.

Representative phase histogram. A Normal phase histogram: The X-axis represents the timing of one cardiac cycle (R-R interval) in degrees. The Y-axis represents the percent of myocardium demonstrating the onset of mechanical contraction during any particular phase of the cardiac cycle. The color maps have 256 levels with the minimum level corresponding to black and the maximum level corresponding to white. B Abnormal phase histogram showing a wide bandwidth indicating a delayed onset of myocardial contraction representing significant left ventricular mechanical dyssynchrony.
