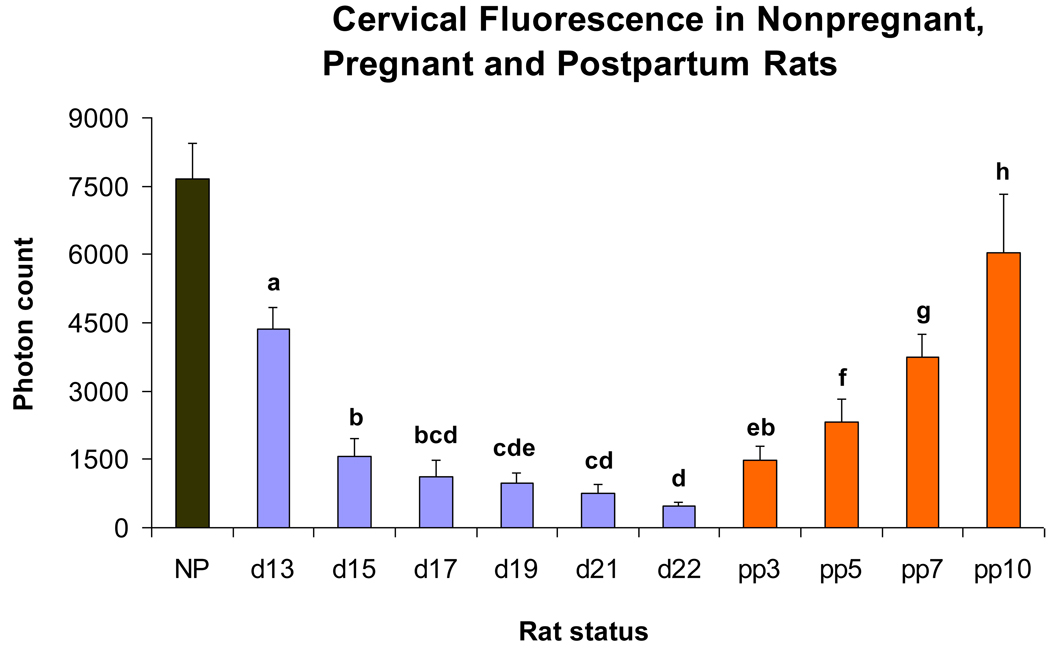
Figure 1.
Bar graphs showing means ± SD of cervical light-induced fluorescence (LIF) obtained in vivo from nonpregnant (N = 3), pregnant (d13, 15 and 17: N = 12/ group; d19 and d21: N = 11 / group; d22: N = 6) and postpartum rats (pp3, 5 and 7: N = 7; pp10: N = 6). Significant differences (P <0 .05) between groups are marked with different letters.

