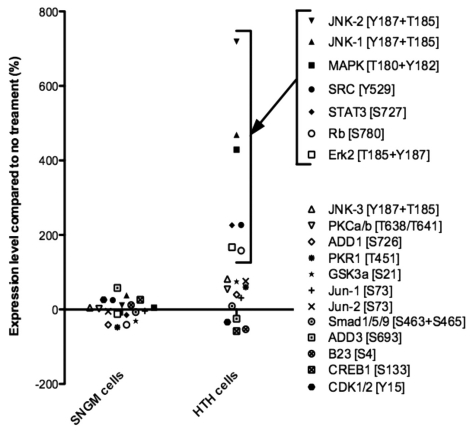
Figure 2.
Summary of quantitative western blot analysis of phosphorylated proteins. Relative levels of phosphorylated proteins in SNG-M and HT-H cells after treatment with GWRQ-MAPS peptide for 30 minutes. Each point represents levels of phosphorylated protein, which either increased or decreased relative to levels seen in the absence of GWRQ-MAPS treatment. Phospho site-specific antibodies were used to detect each protein. The raw data are presented by Figure S5 and S6, Table S1 and S2.

