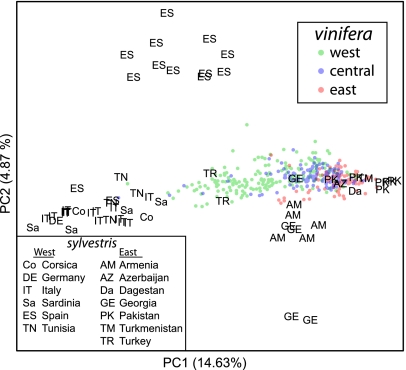
Fig. 4.
Visualization of genetic relationships among sylvestris and vinifera. PC axis 1 (PC1) and PC2 were calculated from 59 sylvestris samples, and 570 vinifera samples were subsequently projected onto these axes. The proportion of the variance explained by each PC is shown in parentheses along each axis. The vinifera samples are represented by circles, and their origins are indicated in the legend. The countries or regions of origin of the sylvestris samples are represented by two-letter codes provided in the legend.

