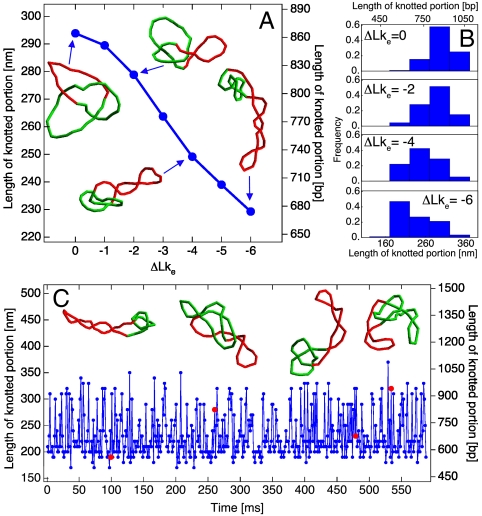
Fig. 2.
Contour lengths of knotted domains. (A) The average contour lengths of knotted domains decrease with increasing specific linking difference of simulated DNA molecules. Snapshots show configurations at ΔLke = 0,-2,-4, and -6 with a knot length corresponding to the peak of the distribution shown in B. (C) The contour length of the knotted domain at ΔLke = -6 fluctuates with time during Brownian dynamics simulation, reflecting the temporal evolution of thermally fluctuating DNA molecules. Insets show configurations corresponding to the simulation times indicated by red dots.

