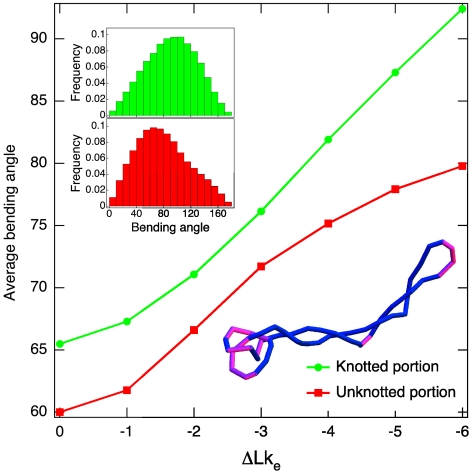
Fig. 4.
DNA supercoiling accentuates the difference in the average bending angles measured for knotted and unknotted portions of simulated DNA molecules [the uncertainty on the average angular values (error on the mean) is within the dot size and ranges between 0.08 and 0.11]. The inset shows the distribution of bending angles for the knotted and unknotted portions of simulated DNA molecules with a specific linking difference of σ = -0.043. The configuration snapshot, where regions with high bending (> 90°) are shown in pink, illustrates that there are two regions favoring Topo II action: the localized knot and the apical loop.

