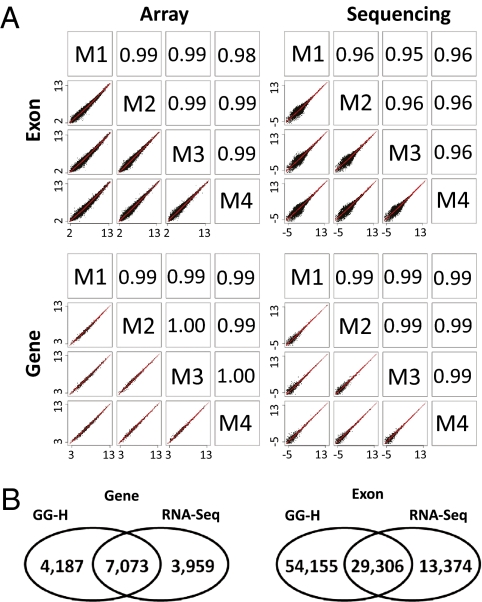
Fig. 2.
Comparison of the performances of the GG-H array and mRNA sequencing. (A) Reproducibility of exon and gene expression measured by array and sequencing. In each panel, scatter plots of logged expression values between four independent replicates of a reference muscle sample are shown in the bottom left corner and in the top right corner, the corresponding Pearson correlation coefficients are shown. (B) Comparison of differentially expressed exons and genes identified by GG-H array and mRNA sequencing.

