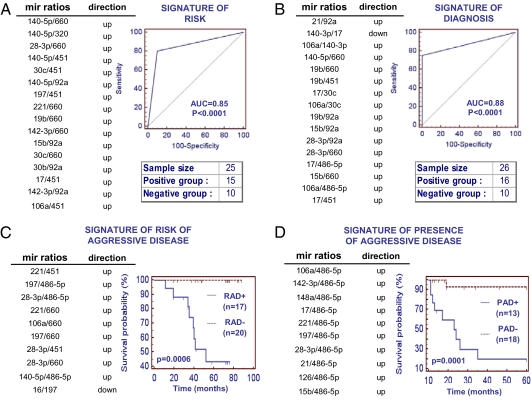
Fig. 4.
miRNA expression analyses in plasma samples collected before the onset and at the time of disease. The signatures of miRNA ratios and their direction in the analyses are listed in the tables. (A) miRNA signature of risk to develop lung cancer and (B) miRNA signature of lung cancer diagnosis. The ROC curves of samples belonging to the validation set are shown. (C) Kaplan–Meier survival curves of patients with miRNA signatures of risk of aggressive disease (RAD) in plasma samples collected 1–2 y before CT-detection of lung cancer. (D) Kaplan–Meier survival curves of patients with miRNA signatures of presence of aggressive disease (PAD) in plasma samples collected at the time of CT-detected lung cancer. The RAD- or PAD-positive patients show a significantly worse survival rate than RAD- or PAD-negative patients (P = 0.0006 and P = 0.0001, respectively).

