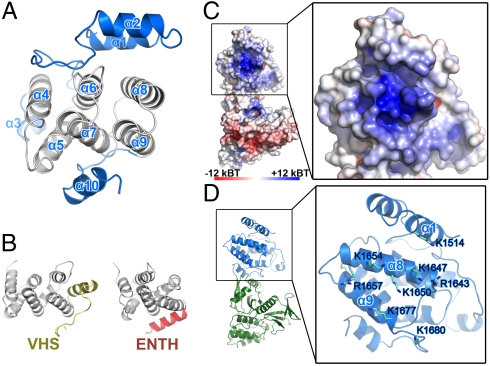
Fig. 3.
The MyoX MyTH4 domain. (A) Ribbon diagram view of MyoX MyTH4. In this drawing, the six-helix bundle core and peripheral regions of MyoX MyTH4 are colored in gray and blue, respectively. (B) The VHS and ENTH domains each contain a similar six-helix bundle (colored in gray) core as MyoX MyTH4 does. (C) Surface analysis of MyoX MyTH4 reveals a highly positively charged surface. The figure is drawn using electrostatistic surface charge potential map. (D) Combined ribbon and stick models showing the residues forming the negatively charged surface shown in C. The molecules in C and D are drawn with the same orientation.

